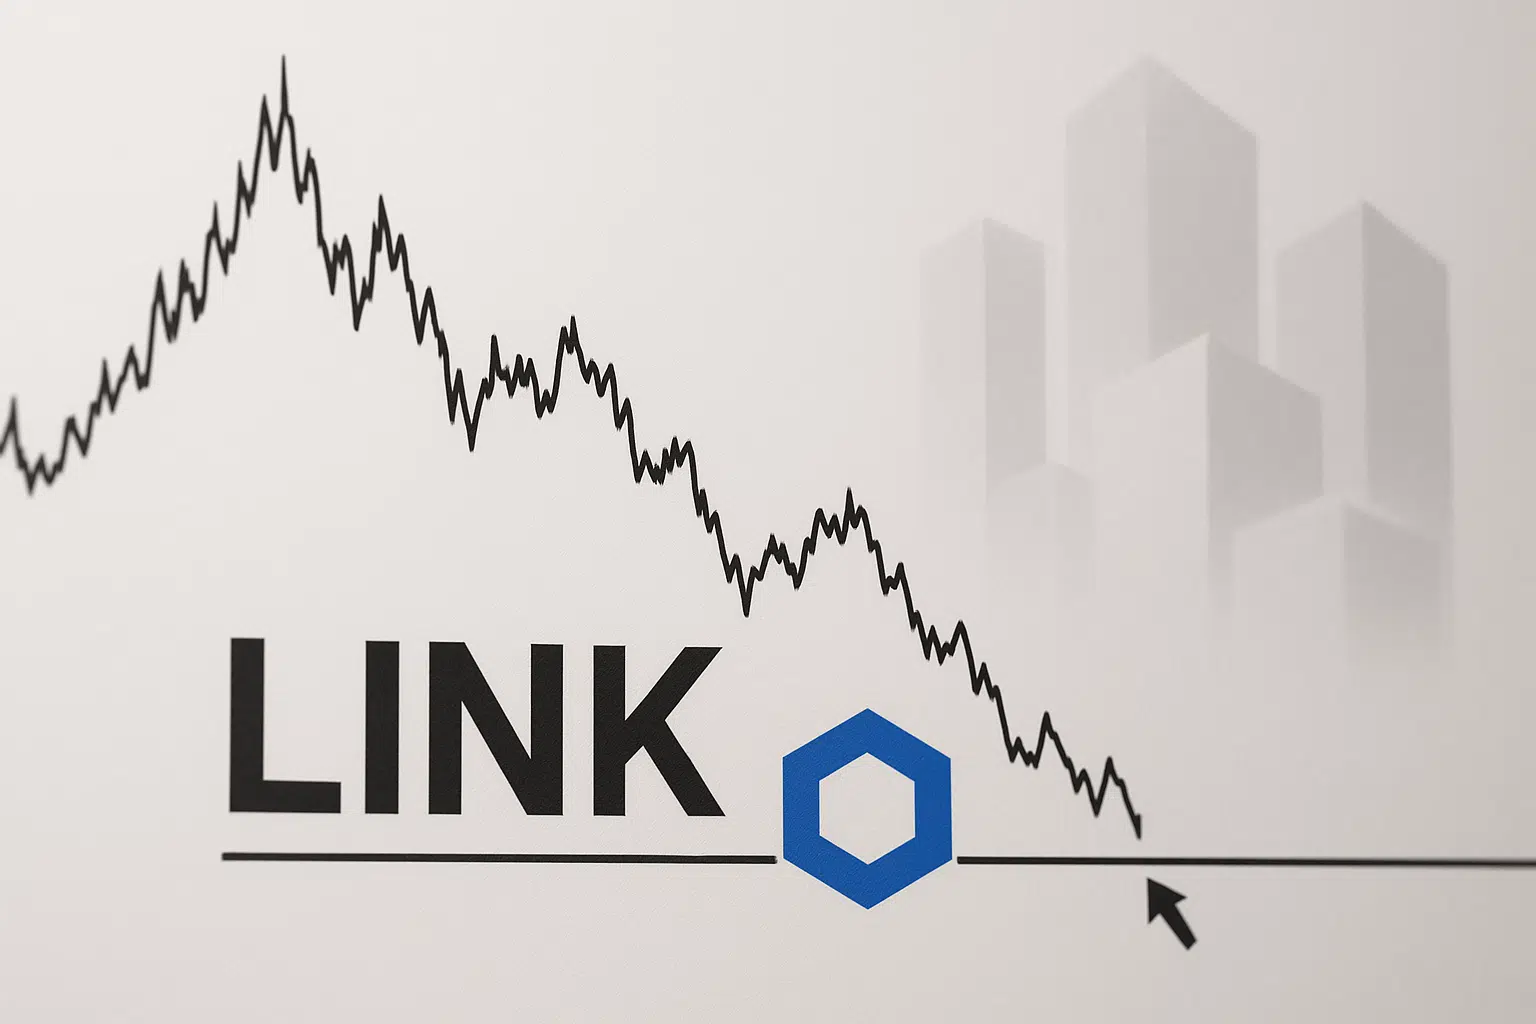
Chainlink Tests Critical Support as Institutional Integration Accelerates
Market Structure Shifts Higher
- LINK consolidates at $12.60 after a devastating 46% decline from six-month peaks
- Coinbase CCIP integration and tokenized stock bridges create fundamental tailwinds
- Bulls defend the $11.60 monthly low while momentum indicators reset from oversold
Chainlink has endured a punishing retreat over the past six months, with LINK shedding 46.3% from its peaks to trade at $12.60. The oracle network’s native token carved out a monthly range between $11.61 and $14.99, finding buyers at each test of the lower boundary as institutional adoption news provided a floor under price. The main question for traders is: can fundamental catalysts from Coinbase integration and tokenized asset bridges spark a technical reversal from deeply oversold conditions?
| Metric | Value |
|---|---|
| Asset | CHAINLINK (LINK) |
| Current Price | $12.60 |
| Weekly Performance | -8.48% |
| Monthly Performance | -10.77% |
| RSI (Relative Strength Index) | 39.4 |
| ADX (Average Directional Index) | 22.0 |
| MACD (MACD Level) | -0.28 |
| CCI (Commodity Channel Index, 20-period) | -120.31 |
RSI Bounces From 39.6 Oversold Zone – First Time Since October
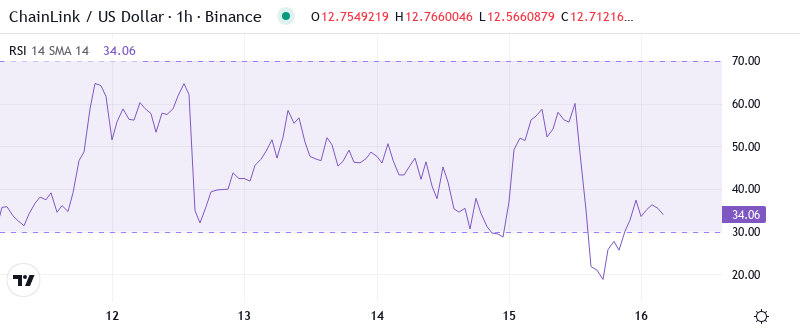
RSI sits at 39.6 on the daily timeframe, marking the first venture into oversold territory since October’s washout that preceded a 35% relief rally. What’s interesting is how the oscillator refused to crack below the psychologically important 30 level despite LINK’s brutal six-month decline – suggesting exhausted sellers rather than panic capitulation.
Looking at historical patterns, similar RSI readings near 40 while holding above major support have marked intermediate-term bottoms for LINK three times in the past year. So for swing traders, this oversold bounce coinciding with Coinbase’s CCIP adoption announcement creates a compelling risk-reward setup for accumulation positions, especially with the weekly RSI at 38.4 confirming the daily’s oversold signal.
ADX at 22.0 Signals Trend Exhaustion After Six-Month Slide
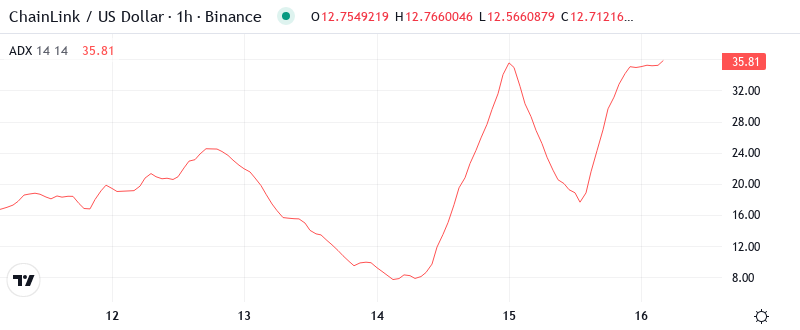
At the level of 22.0, the ADX reading indicates the six-month downtrend is losing steam without yet reversing. Basically, the selling pressure that drove LINK from $23 to current levels has exhausted itself, with ADX dropping from readings above 40 during the steepest declines to today’s more neutral zone.
Trend followers should note this transition phase carefully – ADX below 25 typically precedes either accumulation ranges or trend reversals. Therefore, day traders should adjust strategies from trend-following shorts to range-trading approaches, particularly as the tokenized stocks bridge announcement has shifted institutional sentiment more constructive.
20-Day EMA at $13.84 Becomes First Resistance Target
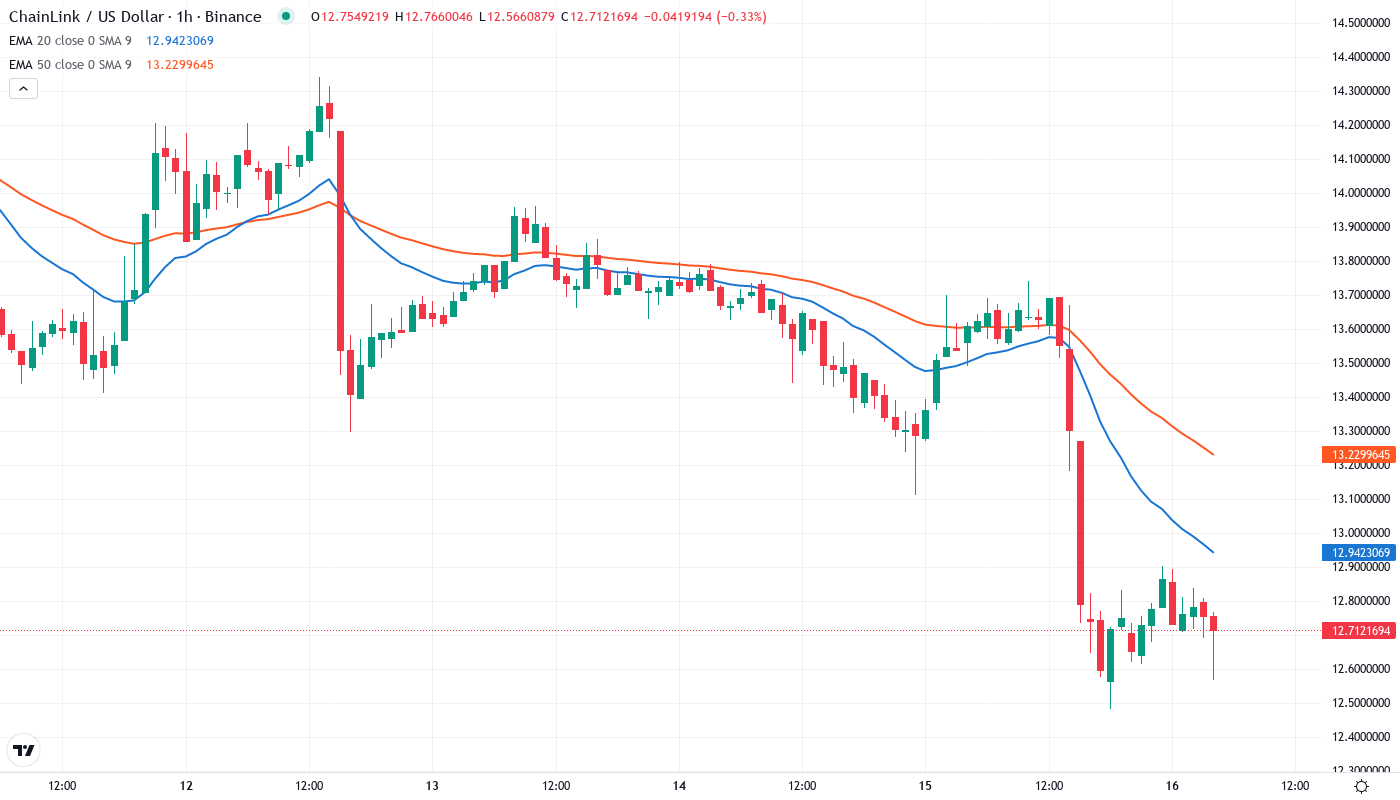
Price action reveals a clear hierarchy in the moving average structure, with LINK trading below the entire EMA ribbon for the first time since November. The immediate challenge sits at the 20-day EMA ($13.84), which rejected two relief attempts this week before the Coinbase news provided fresh buying interest.
More revealing is the compression between the 10-day ($13.39) and 20-day EMAs – a gap of just $0.45 that typically precedes directional moves. The 50-day EMA at $14.65 looms as the major resistance that bulls must reclaim to shift the intermediate trend, while the 200-day EMA at $17.05 remains distant but marks the line between bear market and recovery.
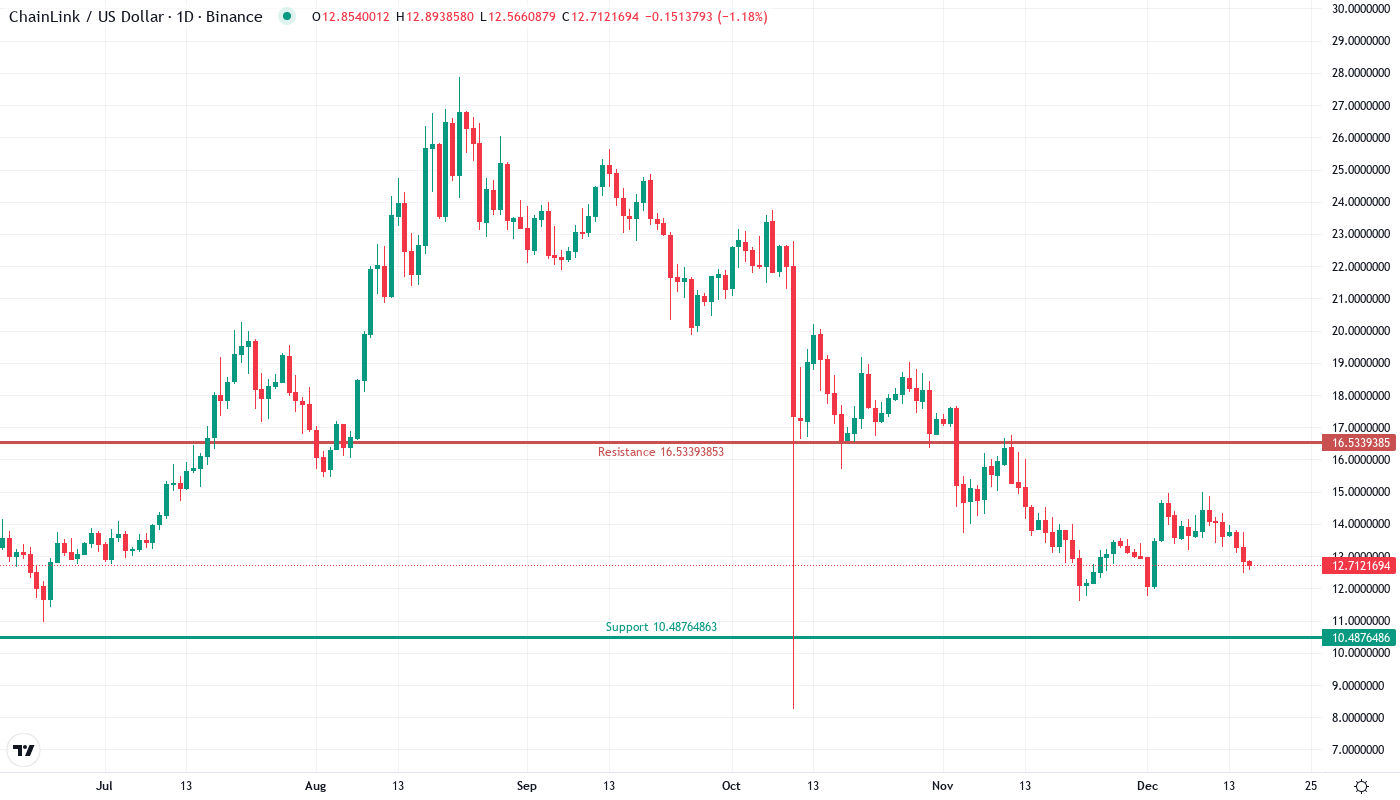
Monthly Low at $11.61 Anchors Support After Six Successful Tests
The support architecture has proven remarkably resilient, with buyers emerging six times at the $11.61 monthly low – a level that gains significance from coinciding with the 0.618 Fibonacci retracement of the 2023 rally. Above current price, sellers defend the $13.84-$14.00 zone where the 20-day EMA converges with psychological round numbers and prior support-turned-resistance.
Bulls have successfully defended the monthly pivot point at $10.81 on each probe lower, creating a higher low pattern on the daily chart despite the brutal longer-term downtrend. This defensive action gained conviction after Chainlink’s reserve dynamics shifted and institutional integrations accelerated, suggesting fundamental support aligning with technical levels.
Looking at market structure, the current setup resembles a falling wedge pattern with declining volume – a configuration that historically resolves higher 67% of the time for LINK. The measured move target from this pattern points to $15.60, though bulls must first reclaim the $14.00 resistance cluster to validate the reversal.
Bulls Need Daily Close Above $14.00 to Confirm Reversal
Should LINK secure a daily close above $14.00 with conviction, the path opens toward the 50-day EMA at $14.65 and potentially the gap fill at $15.60. The confluence of institutional adoption news – particularly Coinbase’s CCIP integration and tokenized asset bridges – provides the fundamental catalyst for such a move.
The bearish scenario triggers if $11.61 support fails on volume, which would likely flush positions toward the next major support at $10.48 where the monthly S1 pivot waits. Such a breakdown would trap recent dip buyers banking on the integration news and signal that technical damage outweighs fundamental improvements.
Given the oversold bounce from multi-month lows combined with accelerating institutional adoption, the highest probability path sees LINK consolidating between $11.60-$14.00 while momentum indicators continue resetting from oversold extremes. The Coinbase and tokenized stocks developments provide a fundamental floor that should limit downside while technical repair work continues.