BNB Surge Stalls at $850 as Regulatory Clarity Looms – Bulls Guard Critical Support

Market Structure Shifts Higher
- BNB tests monthly resistance at $850 after climbing from $637 December lows
- 2.4 million daily users on BNB Chain signal ecosystem strength despite price consolidation
- UK Treasury’s 2027 regulatory framework could unlock institutional flows
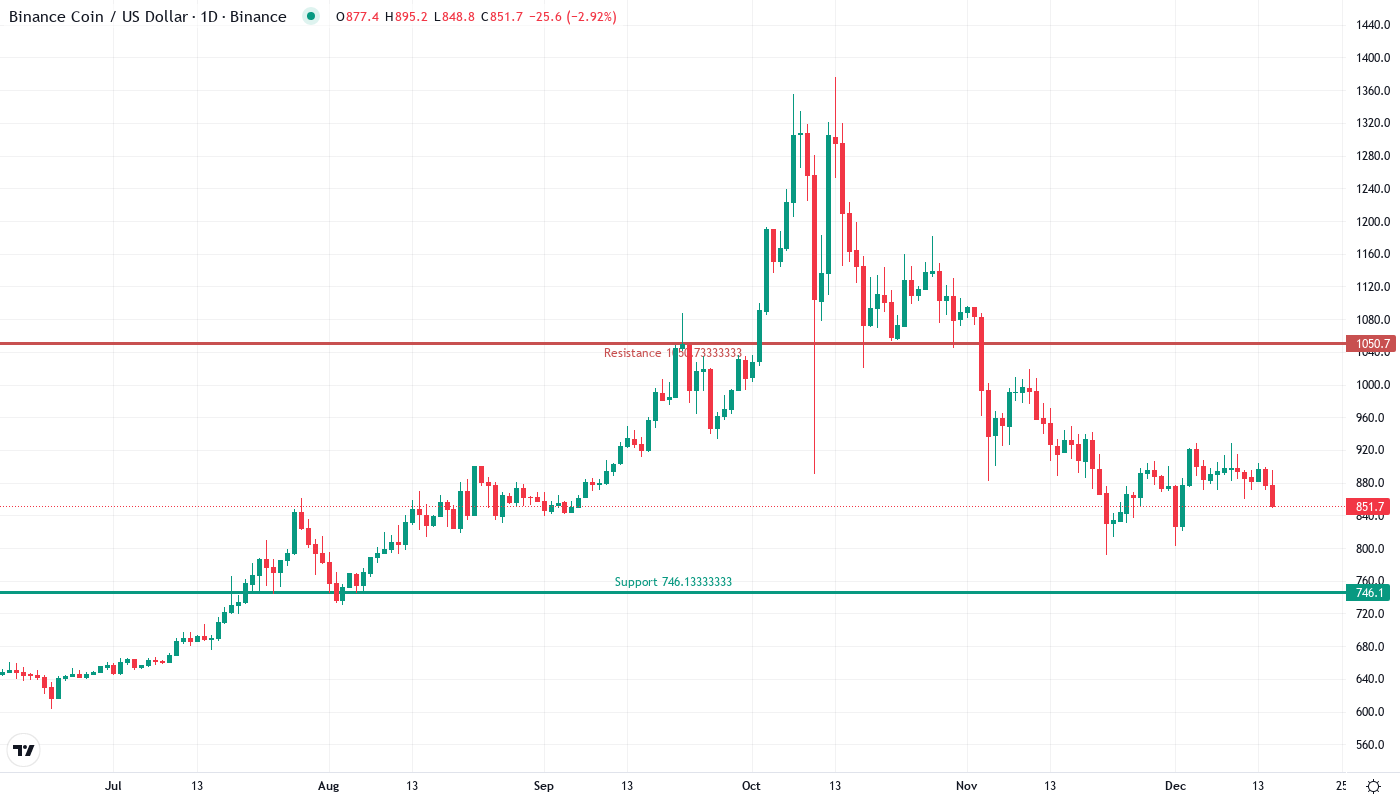
BNB’s momentum has cooled after a sharp rally from December’s $637 floor to current levels around $850, with the token down 4.8% over the past week but still maintaining an 18.9% yearly gain. The surge that kick-started from the $637 support zone in December has now met selling pressure at the psychological $850 resistance, where price has consolidated for several sessions. The main question for traders is: can bulls defend the reclaimed support levels while building energy for another assault on resistance, or will profit-taking drive a deeper retracement?
| Metric | Value |
|---|---|
| Asset | BNB (BNB) |
| Current Price | $850.90 |
| Weekly Performance | -4.77% |
| Monthly Performance | -7.23% |
| RSI (Relative Strength Index) | 39.2 |
| ADX (Average Directional Index) | 23.8 |
| MACD (MACD Level) | -13.16 |
| CCI (Commodity Channel Index, 20-period) | -112.65 |
RSI Cools to 39.2 After December’s Oversold Bounce
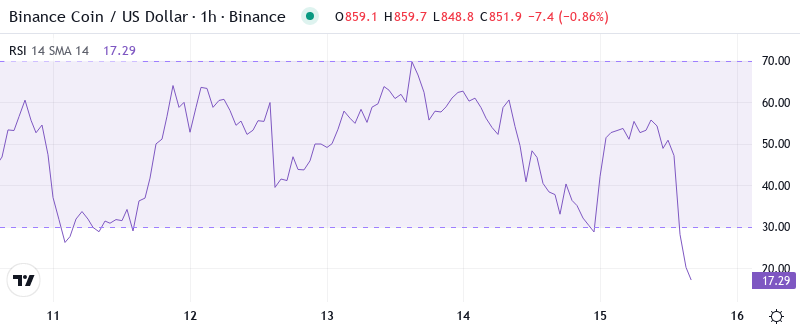
Reading the oscillator at 39.2 on the daily timeframe, momentum has pulled back from neutral territory into the lower ranges – not quite oversold but showing fatigue after the recent surge. This cooling phase follows a pattern seen in October when RSI dipped to similar levels before BNB launched its next leg higher, suggesting the current pullback might be a healthy reset rather than trend exhaustion.
What’s revealing is how RSI barely budged during the initial resistance test at $850, maintaining readings above 50 until this week’s rejection. So for swing traders, this momentum reset opens potential entry zones if price can hold above the 50-day EMA at $925, with RSI likely to confirm any renewed strength by reclaiming the 50 centerline on the next push higher.
ADX at 23.8 Signals Trend Losing Steam But Not Dead
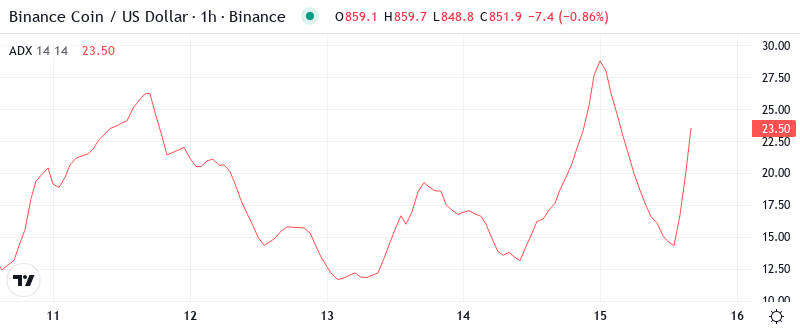
Trend strength indicators show ADX sitting at 23.8, down from readings above 30 during December’s impulsive rally but still hovering near the 25 threshold that separates trending from choppy markets. Basically, we’re in that transition zone where the previous trend hasn’t fully exhausted but needs fresh catalyst to continue – precisely where news like the UK Treasury’s regulatory framework announcement could provide the spark.
To clarify, the ADX is indicating that day traders should prepare for potential range expansion in either direction, as the market coils between support and resistance. The 2.4 million daily users on BNB Chain provide fundamental backing for bulls, but technical traders need to see ADX climb back through 25 with price confirmation to signal the uptrend’s resumption.
50-Day EMA at $925 Becomes Next Line of Defense
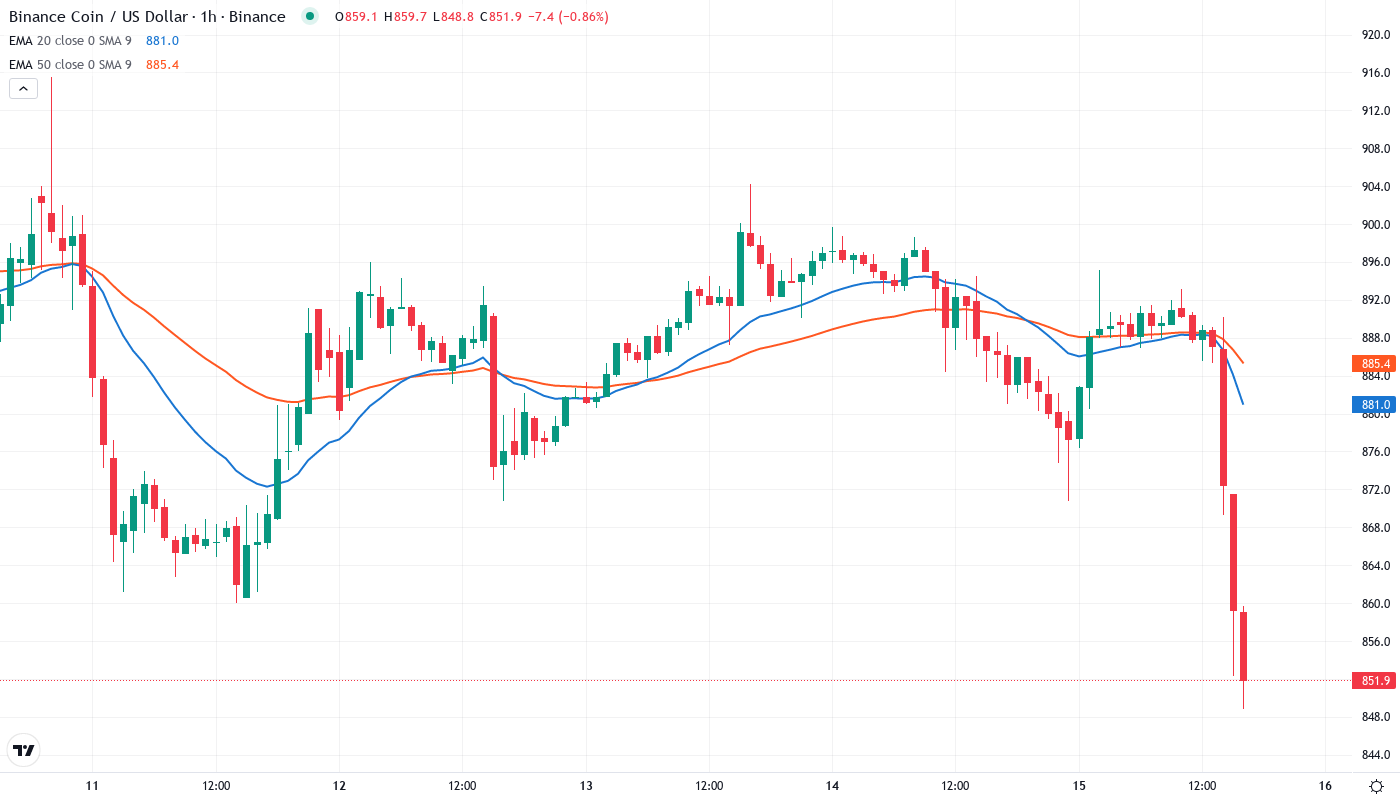
Price action currently trades below the immediate 10-day ($881) and 20-day ($888) EMAs after failing to sustain above the psychological $900 level, but crucially remains above the 50-day EMA at $925. This medium-term average changed from being a resistance level to a support one during December’s rally, and now serves as the key technical level bulls must defend to maintain structural integrity.
Looking at the broader moving average architecture, the 100-day EMA sits at $935 just above current price action, creating a resistance cluster between $925-$935 that coincides with the monthly R1 pivot at $1,050. The 200-day EMA provides distant support at $882, but any sustained break below the 50-day would likely target this level quickly, potentially trapping late buyers who entered during the UK regulatory news.
Resistance Clusters Between $900 and $1,050 as Bulls Reload
Above current price, sellers have stacked orders at multiple confluence zones, starting with the immediate psychological barrier at $900 where the 10 and 20-day EMAs converge. The more significant resistance band spans from $935 (100-day EMA) to $1,050 (monthly R1 pivot), representing a 23% upside from current levels but requiring sustained buying pressure backed by continued ecosystem growth metrics.
Bulls defend multiple support layers beneath current price action, with the most immediate floor at $813 (weekly S1) followed by the critical $800 psychological level that held during December’s accumulation phase. The December low at $637 now represents the line in the sand for the broader uptrend, sitting near the weekly S3 at $594 – a level that would devastate late longs if retested.
Market structure reveals a compression pattern between $800 support and $900 resistance, with the wider range defined by December’s $637 low and November’s $950 high. This consolidation phase resembles similar setups from Q3 2024, where BNB built energy within defined ranges before explosive moves once regulatory clarity emerged – a pattern that could repeat as the UK’s 2027 framework approaches.
Bulls Need Decisive Close Above $900 to Reignite Rally
Should price reclaim the $900 psychological level with a daily close above the 20-day EMA at $888, bulls would target the resistance cluster at $935-$950 where November highs meet the 100-day EMA. The growing BNB Chain user base provides fundamental fuel for such a move, especially if paired with further regulatory developments that reduce institutional uncertainty.
The bearish scenario triggers if support at $813 fails on volume, opening a swift path to retest the 200-day EMA at $882 and potentially the $800 psychological floor. Such a breakdown would trap recent buyers who entered on UK regulatory optimism, likely flushing positions down toward the December low at $637 if selling accelerates – though the 2.4 million daily active users suggest any deep correction would find organic buying interest.