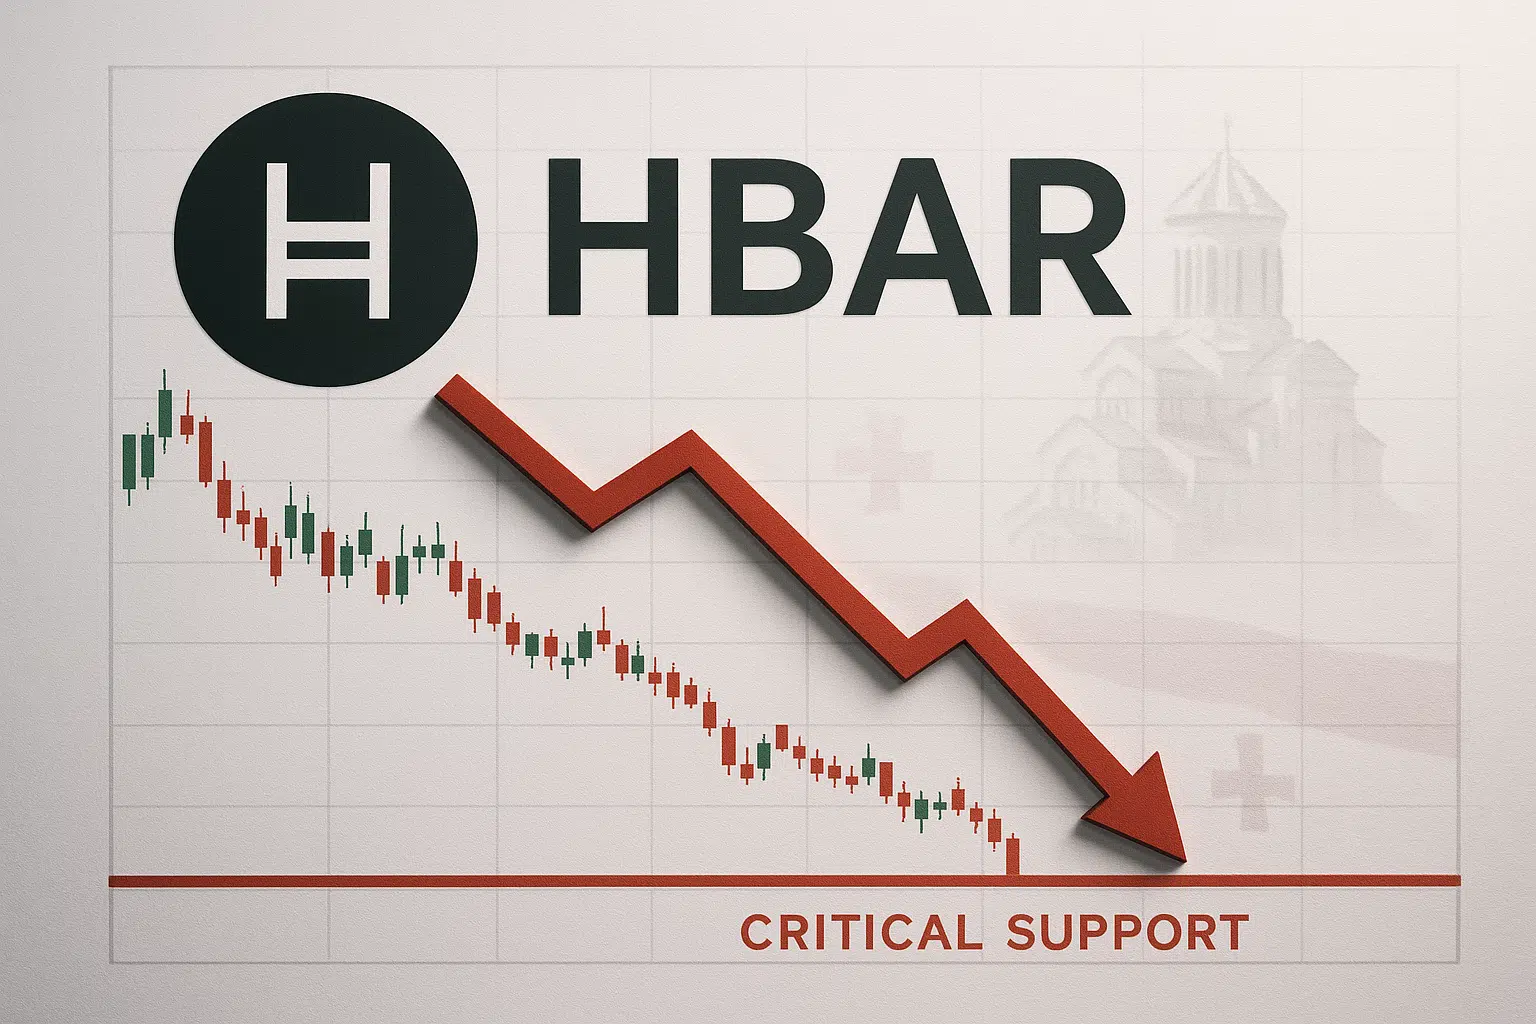
HBAR Tests Critical Support as Georgia Partnership Fails to Spark Recovery
Market Pulse
- HBAR consolidates near $0.12 after shedding 22% in the past month
- Georgia Justice Ministry partnership highlights institutional adoption progress
- Technical indicators signal oversold bounce potential from six-month tested support
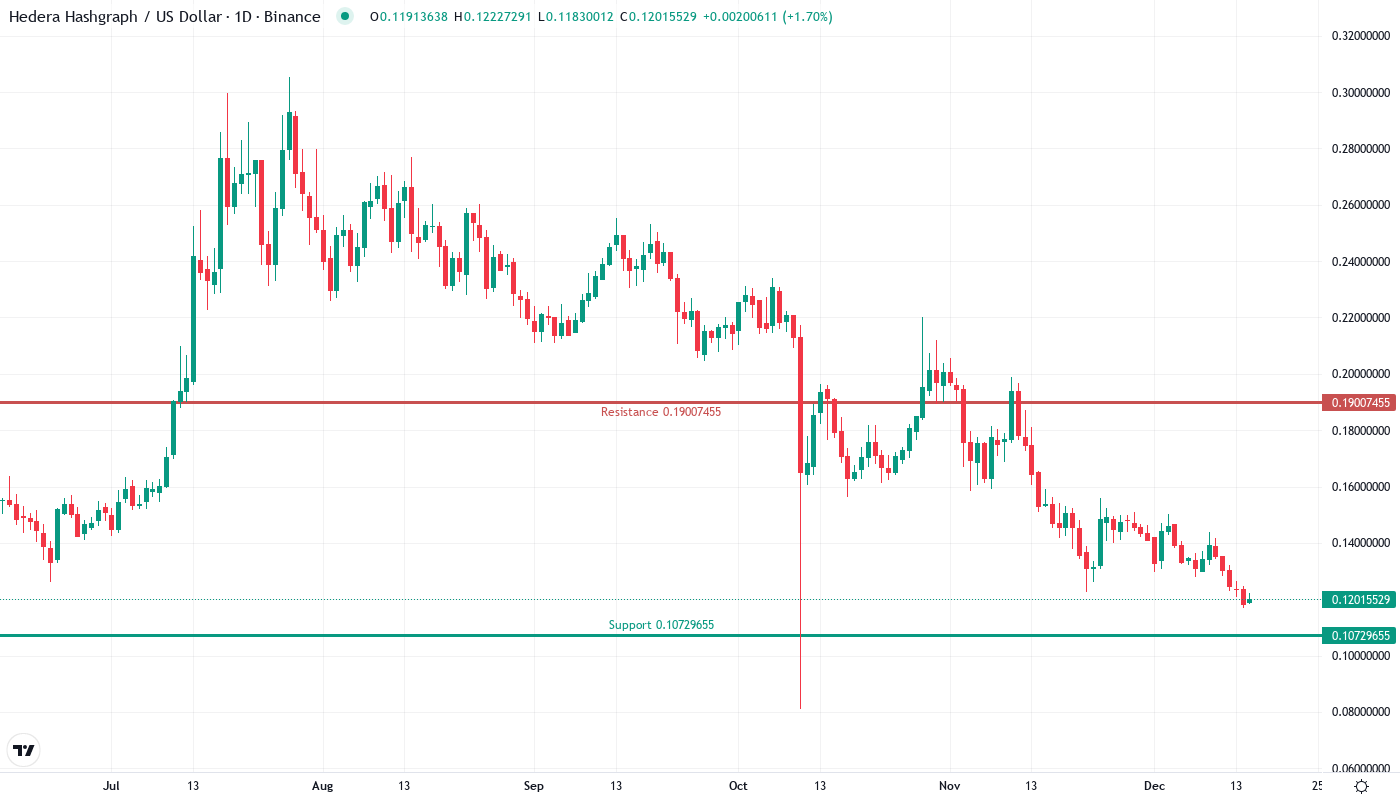
Hedera’s HBAR token trades at $0.120, marking a devastating 22% monthly decline that erased gains from November’s institutional partnerships. The token’s struggle to maintain momentum despite significant real-world adoption news – including this week’s blockchain implementation agreement with Georgia’s Justice Ministry – raises questions about whether technical exhaustion or broader market dynamics are overwhelming positive fundamentals. The main question for traders is: can HBAR’s six-time tested support at $0.117 hold against persistent selling pressure, or will the disconnect between bullish news and bearish price action continue?
| Metric | Value |
|---|---|
| Asset | HEDERA (HBAR) |
| Current Price | $0.12 |
| Weekly Performance | -7.72% |
| Monthly Performance | -21.85% |
| RSI (Relative Strength Index) | 34.5 |
| ADX (Average Directional Index) | 24.9 |
| MACD (MACD Level) | -0.01 |
| CCI (Commodity Channel Index, 20-period) | -152.34 |
RSI at 34.46 Signals First Oversold Territory Since August Capitulation
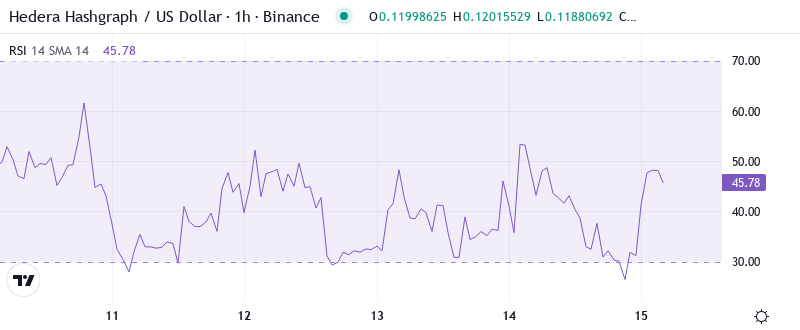
Reading the oscillator at 34.46 on the daily timeframe reveals momentum has reached oversold conditions for the first time since August’s market-wide washout. This exhaustion comes after HBAR shed nearly 50% from its three-month peak, with sellers maintaining control despite multiple partnership announcements that would typically support price. The RSI’s descent below 35 historically marked local bottoms in June and August, both times preceding 20-30% relief rallies within two weeks.
What’s revealing is how RSI barely budged despite Georgia’s Justice Ministry news – a sign that technical selling overwhelms fundamental catalysts. So for swing traders, this oversold reading combined with approaching support suggests a bounce setup is forming, though any rally faces resistance from trapped longs eager to exit. The weekly RSI at 34.86 confirms the oversold condition extends beyond daily noise, indicating genuine capitulation rather than a brief dip.
ADX at 24.88 Shows Trend Strength Building From December’s Chop
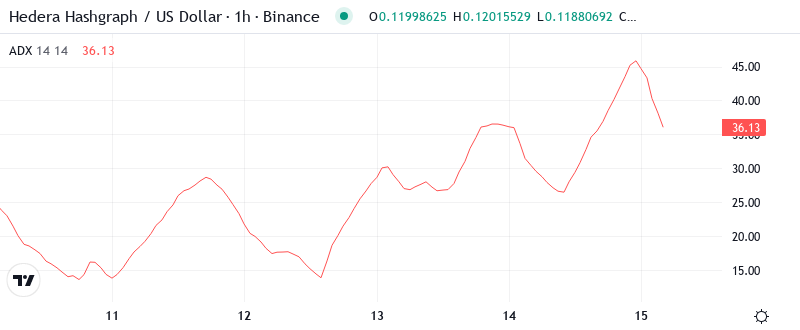
Trend strength indicators paint a concerning picture with ADX climbing to 24.88, up from 18 just two weeks ago. Basically, the market is transitioning from December’s range-bound conditions into a trending state – unfortunately for bulls, that trend points decisively lower. The shift occurred precisely as HBAR failed to hold above the psychological $0.15 level despite Archax completing regulated after-hours trades on Hedera’s network.
To clarify, when ADX rises while price falls, it signals conviction behind the selling rather than exhausted profit-taking. Therefore, day traders should adapt strategies for trending conditions rather than expecting quick reversals at support. The acceleration in trend strength suggests institutional players who accumulated during November’s partnership announcements may be distributing into retail buying sparked by this week’s Georgia news.
Price Trapped Below Entire EMA Cloud Since Mid-December Break
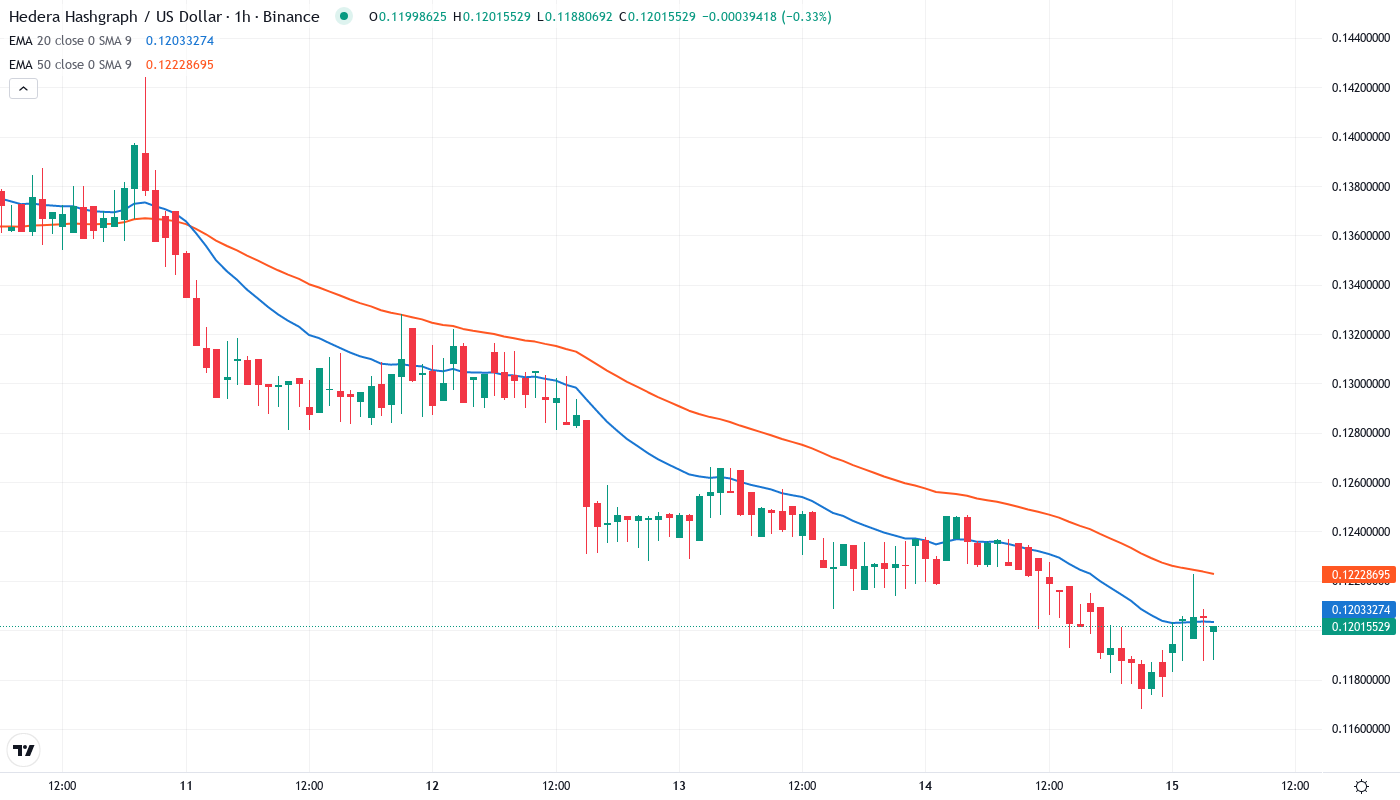
Moving average structure reveals the technical damage clearly – HBAR trades below the complete EMA ribbon from the 10-day ($0.128) through the 200-day ($0.174). Most critically, the 50-day EMA at $0.151 that provided support through November’s accumulation phase now acts as resistance, rejecting recovery attempts three times since December 15th. This systematic breakdown of moving average support coincided with broader crypto market weakness, but HBAR’s underperformance stands out given its institutional adoption progress.
The 20-day EMA at $0.134 represents the nearest resistance hurdle for any relief bounce, sitting roughly 12% above current levels. Bulls face a daunting task – not only must they defend immediate support, but they need to reclaim at least the 20-day EMA to shift short-term momentum. It is worth mentioning that similar EMA compression in September resolved violently lower, taking HBAR from $0.08 to $0.05 before finding a bottom.
Support at $0.117 Tested Six Times – Bulls’ Final Stand
Resistance stacks heavy between the 20-day EMA at $0.134 and December’s breakdown point at $0.156, with multiple failed rallies creating overhead supply. The zone from $0.145 to $0.156 particularly concerns bulls – it contains the monthly pivot, the 50-day EMA, and trapped buyers from December’s false breakout attempt. Any relief rally faces selling pressure at these technical confluences, regardless of positive news flow like mirror node optimizations or regulatory breakthroughs in crypto banking.
On the support side, $0.117 emerges as the critical line after bouncing price six times since June. This level’s repeated defense makes it psychologically significant – a break below would likely trigger stop-losses and potentially target the yearly low at $0.097. The weekly pivot at $0.126 offers minor support above, but lacks the historical significance of the $0.117 floor.
Market structure signals waning buyer conviction despite institutional adoption milestones. The pattern of lower highs since November’s peak, combined with support tests becoming more frequent, suggests accumulation is exhausted. Even news of regulated financial infrastructure building on Hedera fails to attract fresh capital at current levels.
Bulls Need Decisive Close Above $0.134 to Shift Momentum
Recovery requires a daily close above the 20-day EMA at $0.134 with volume exceeding the 10-day average. Such a move would confirm the oversold bounce and open paths to test the 50-day EMA at $0.151. Bulls need continued institutional adoption news – particularly around the Georgia implementation – to provide fundamental backing for any technical recovery attempt.
The bearish scenario triggers if $0.117 support breaks on volume, especially if ADX continues rising above 25. This would trap recent buyers betting on the Georgia news catalyst and likely flush positions down to $0.097 – a 20% drop from current levels. Given that positive fundamentals haven’t stemmed the decline, technical breakdown would accelerate selling regardless of partnership announcements.
With oversold indicators, six-time tested support, and institutional adoption accelerating, the most probable near-term path sees HBAR consolidating between $0.117-$0.134 while the market digests whether real-world utility can overcome technical weakness. The disconnect between bullish fundamentals and bearish technicals typically resolves when one side capitulates – and current price action suggests sellers maintain control despite Hedera’s ecosystem progress.