Aptos Slides to $1.64 as Technical Structure Deteriorates Below Key Support
Market Structure Shifts Lower
- APT tumbles 44.6% over the past month, erasing gains from earlier in the year
- Technical indicators flash oversold signals after price drops below multiple support levels
- DeFi yield infrastructure development continues despite harsh price action
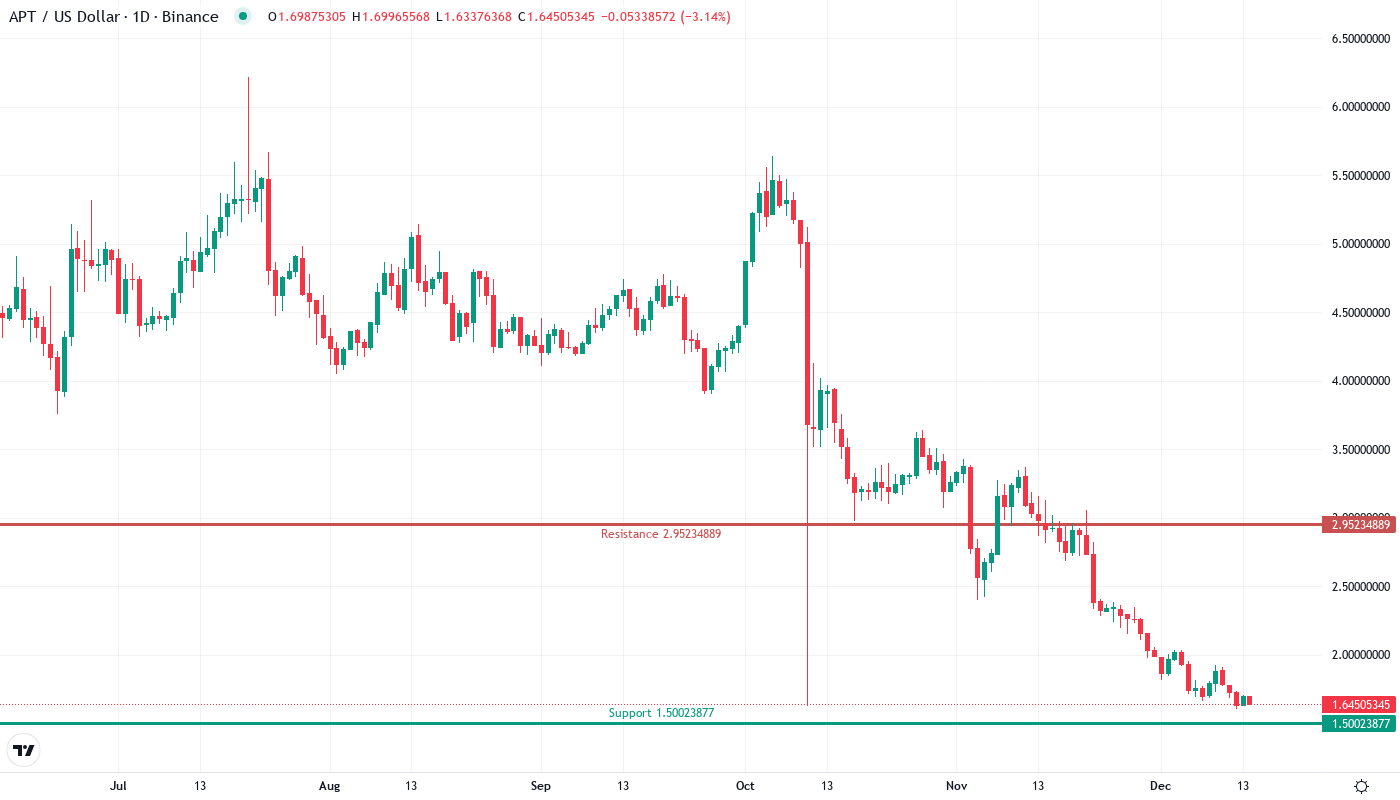
Aptos has endured a devastating drop to $1.64, shedding 44.6% over the past month and an eye-watering 63.8% across the last quarter. The altcoin’s price action tells a story of systematic support failures, with bulls unable to defend any meaningful level as selling pressure intensified throughout December. The main question for traders is: has APT finally found a floor near these multi-month lows, or does the technical damage suggest further downside ahead?
| Metric | Value |
|---|---|
| Asset | APTOS (APT) |
| Current Price | $1.64 |
| Weekly Performance | -6.68% |
| Monthly Performance | -44.60% |
| RSI (Relative Strength Index) | 30.6 |
| ADX (Average Directional Index) | 50.0 |
| MACD (MACD Level) | -0.26 |
| CCI (Commodity Channel Index, 20-period) | -98.20 |
RSI Plunges to 31.02 – Deepest Oversold Reading Since Spring Collapse
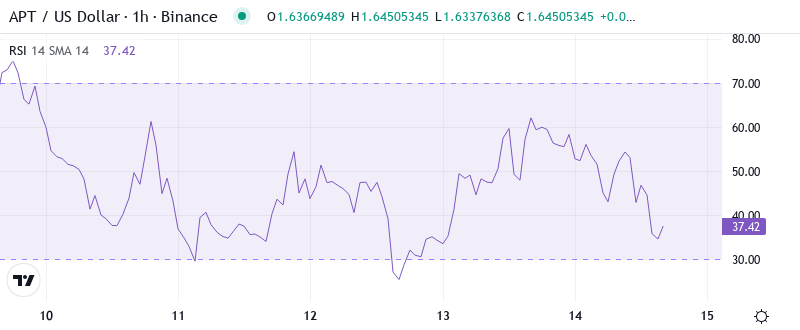
Reading the oscillator at 31.02, traders see momentum exhaustion that typically marks capitulation phases. This marks APT’s most oversold condition on the daily timeframe since the broader crypto washout earlier this year, when similar RSI extremes preceded a multi-week relief rally. Basically, the indicator screams that sellers have pushed too hard, too fast – creating conditions ripe for at least a technical bounce.
What’s revealing is how RSI behaved during the descent – it broke below 40 in early December and never recovered, confirming genuine selling pressure rather than a quick flush. So for swing traders, this deeply oversold reading suggests waiting for RSI to reclaim 40 before attempting any long positions, as that would signal the first real momentum shift in weeks.
ADX at 50.05 Confirms Mature Downtrend Nearing Exhaustion Point
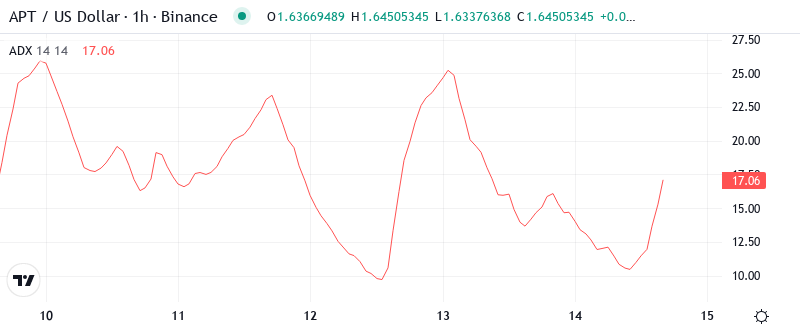
Trend strength readings have exploded to 50.05, marking one of the strongest directional moves in APT’s recent history. At these extreme levels, the ADX indicates that the downtrend has matured significantly – often a precursor to either consolidation or reversal. The indicator essentially confirms what price action shows: sellers maintained complete control throughout this decline.
Historically, when ADX climbs above 50 for Aptos, the trending move typically exhausts within days rather than weeks. To clarify, while the trend remains firmly bearish, the extreme ADX reading suggests day traders should prepare for ranging conditions ahead as the one-sided selling pressure loses steam. The Goblin Finance funding announcement bringing $1M to build Aptos’ yield layer couldn’t stem the technical bleeding, but it might provide fundamental support as momentum indicators reset.
Price Trapped Below Entire EMA Ribbon Since Mid-December
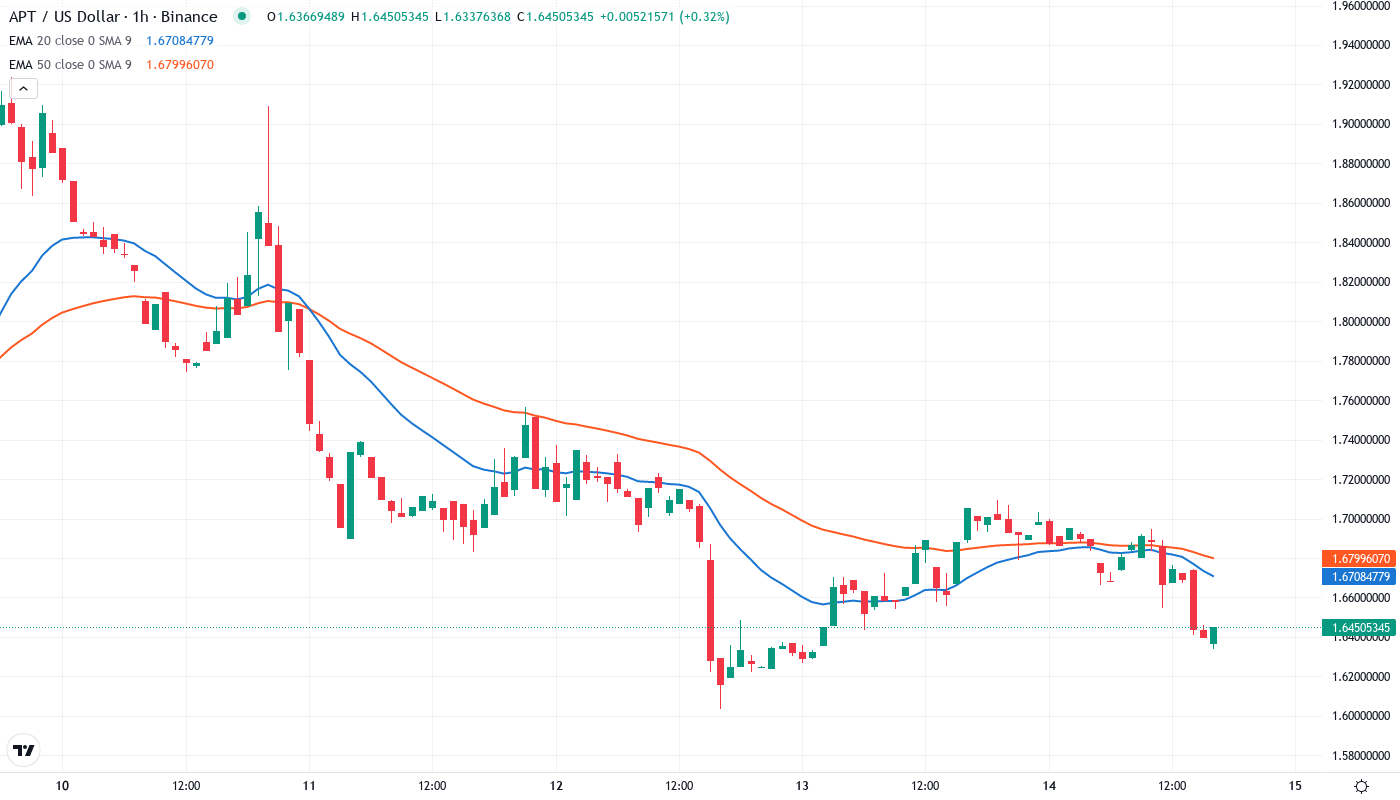
The moving average structure paints a grim picture for bulls. APT currently trades at $1.64, decisively below the 10-day ($1.76), 20-day ($1.94), and 50-day EMAs ($2.13) – with each average acting as resistance on any bounce attempts. Most telling is the compression between the 10-day and 20-day EMAs, which typically precedes either a sharp reversal or continuation of the prevailing trend.
During the December collapse, the 50-day EMA flipped from support to resistance after three failed reclaim attempts, confirming the bearish market structure. That former support area at $2.13 now transforms into a red line for bears to defend on any relief rally. The 100-day EMA sits even higher at $2.48, creating multiple resistance layers that bulls must overcome to shift the narrative.
Resistance Stacks Heavy Between $1.94 and $2.48
Above current levels, sellers have fortified their positions with multiple resistance zones. The immediate ceiling sits at $1.76 where the 10-day EMA converges with recent breakdown levels, followed by stronger resistance at $1.94 (20-day EMA) and the psychologically important $2.00 round number. These levels rejected every bounce attempt over the past two weeks, trapping late buyers who expected a quick reversal.
Support architecture looks fragile after multiple failures, with only minor cushions at $1.60 and $1.50 before reaching the yearly low near $1.45. The monthly pivot point at $1.50 might offer some defense, but the lack of historical price memory in this zone leaves bulls vulnerable. Each support test has seen decreasing volume, suggesting exhaustion among defenders at these levels.
Bulls Need Convincing Close Above $1.94 to Halt Downtrend
For any sustainable recovery to begin, bulls must first reclaim the 20-day EMA at $1.94 on solid volume – this would mark the first higher high since November. Should that occur, targets would extend to $2.13 (50-day EMA) and eventually $2.48, where the DeFi yield development narrative could provide fundamental tailwinds for continuation.
The bearish scenario triggers if APT loses $1.50 support on a daily close, which would likely flush positions down to the $1.45 yearly low or potentially lower toward $1.20. Such a move would trap recent bottom-fishers and could cascade into capitulation selling, regardless of positive fundamental developments.
Given the deeply oversold conditions and extreme ADX readings, the most probable near-term path is sideways consolidation between $1.50-$1.76 as momentum indicators reset from extremes. This ranging action would allow the technical damage to heal before determining the next directional move.