Bitcoin Cash Darts Past $575 as Whale Accumulation Meets Technical Confluence

Market Structure Shifts Higher
- BCH surges 14% monthly despite broader crypto weakness, testing December highs near $607
- Institutional inclusion via Bitwise’s SEC-approved index fund reinforces buyer confidence
- Technical indicators flash multiple bullish signals as price reclaims key moving averages
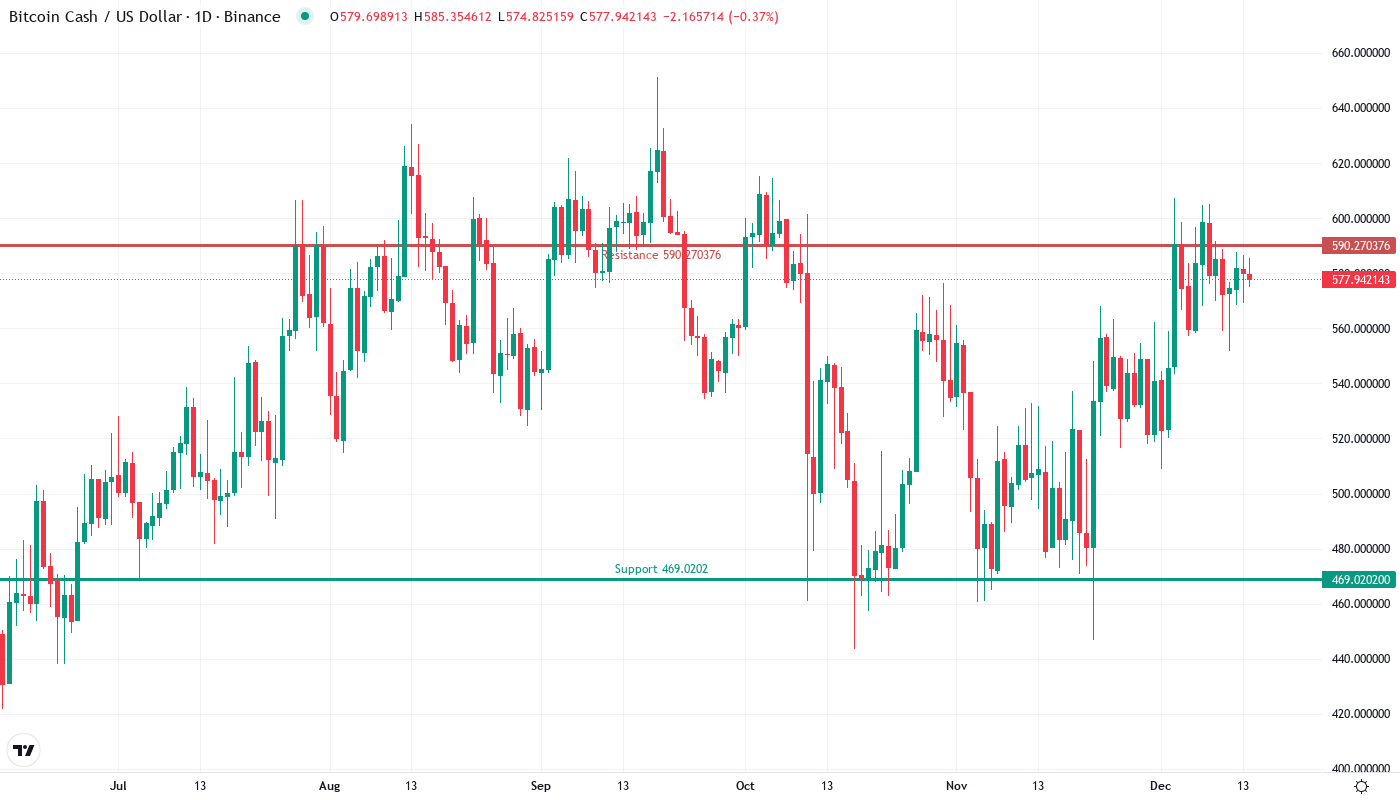
Bitcoin Cash kick-started 2025 with conviction, climbing 13.85% over the past month to $578 as whale accumulation converged with positive regulatory developments. The surge marks BCH’s strongest monthly performance among major layer-1 blockchains, with the coin defending the $555-$575 range even as broader crypto markets wobbled. The main question for traders is: can this momentum carry BCH through the psychological $600 barrier after the recent rejection at $607?
| Metric | Value |
|---|---|
| Asset | BITCOIN CASH (BCH) |
| Current Price | $578.08 |
| Weekly Performance | -0.88% |
| Monthly Performance | 13.85% |
| RSI (Relative Strength Index) | 55.5 |
| ADX (Average Directional Index) | 25.2 |
| MACD (MACD Level) | 15.07 |
| CCI (Commodity Channel Index, 20-period) | 57.67 |
RSI at 55.46 Signals Fresh Momentum After December Reset
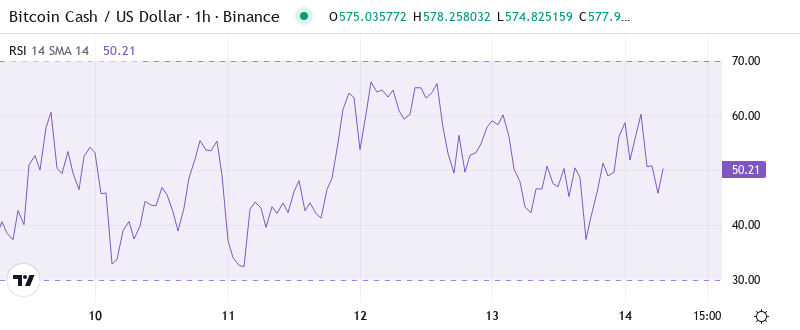
RSI sits at 55.46 on the daily timeframe, indicating perfectly balanced conditions after resetting from overbought territory above 70 in early December. This neutral reading gives BCH room to run in either direction without immediate exhaustion concerns. Similar RSI configurations in September preceded BCH’s surge from $350 to $500, suggesting the current setup favors continuation rather than reversal.
So for swing traders, this balanced RSI means entries remain attractive as long as price holds above the 50-day EMA at $546. The recent inclusion in Bitwise’s SEC-approved crypto index fund appears to have steadied sentiment, preventing the deeper RSI drops that typically accompany major corrections. What’s particularly revealing is how RSI barely budged despite BCH testing and rejecting at the monthly high of $607 – a sign that sellers lack conviction at these levels.
ADX Climbs to 25.22 as BCH Transitions From Chop to Trending
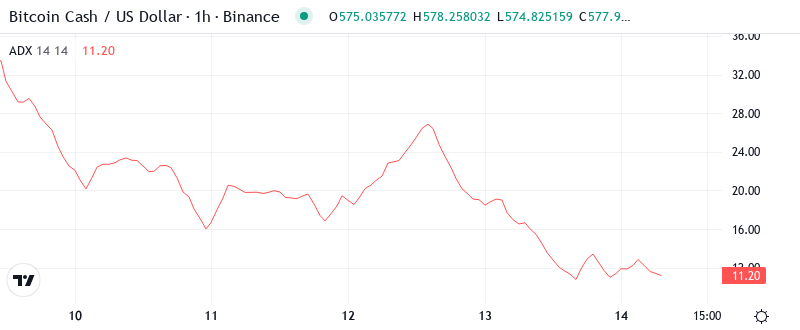
Looking at trend strength indicators, the ADX reading of 25.22 marks a decisive shift from the sub-20 doldrums that plagued BCH through November. Basically, this climb above the 25 threshold signals we’re transitioning from range-bound conditions to a trending environment where momentum strategies gain edge. The acceleration mirrors patterns from BCH’s October breakout, when ADX surged from 18 to 35 as price added 40%.
Therefore, day traders should adapt their playbooks from mean reversion to trend following as this ADX expansion typically sustains for 2-3 weeks once initiated. The combination of whale accumulation news and technical breakouts has clearly energized directional movement. To clarify, ADX doesn’t predict direction but confirms that whatever move develops will likely pack conviction – and current price action suggests that conviction favors bulls.
20-Day EMA at $563 Flips to Support After Three December Tests
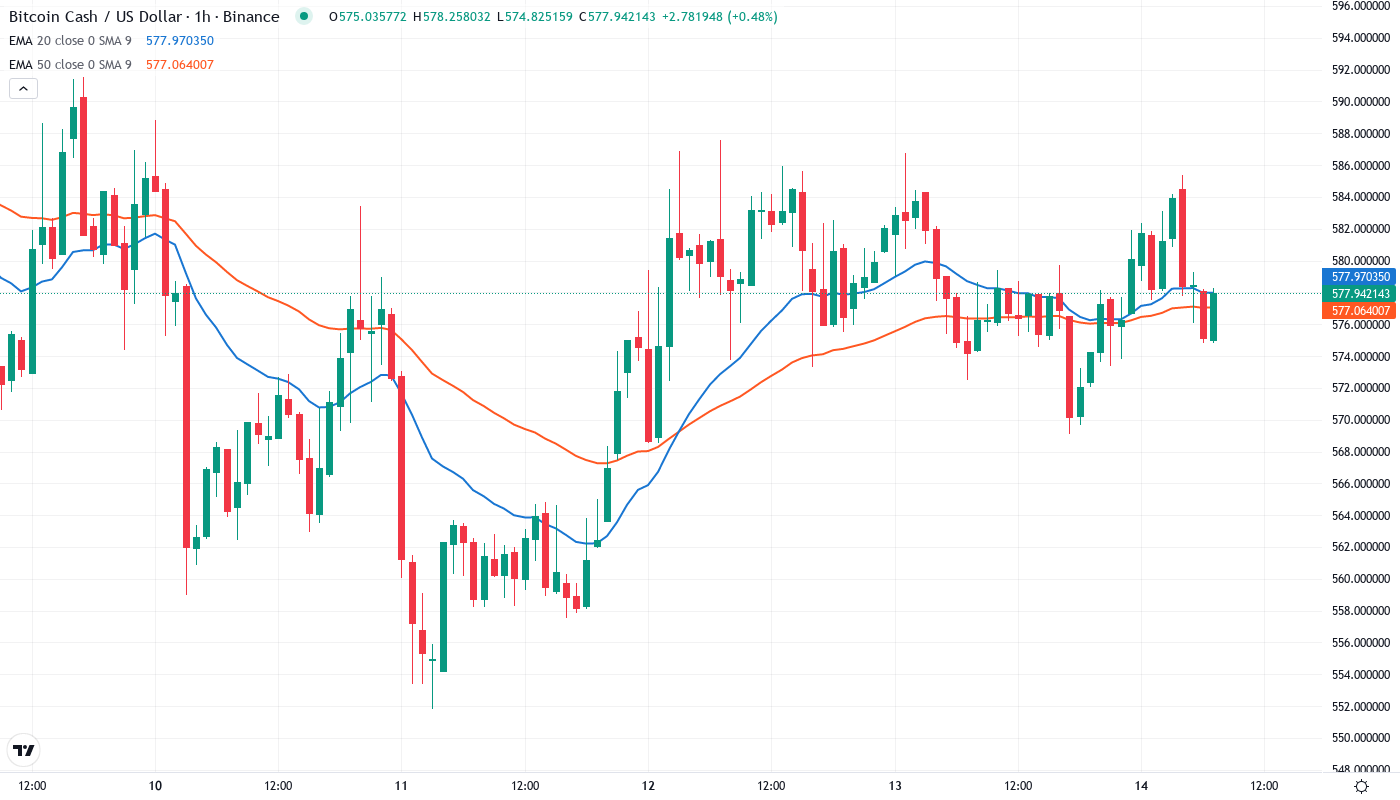
Price action through the EMA ribbons tells a compelling story of structural improvement. BCH trades comfortably above the 10-day ($575), 20-day ($563), and crucially, the 50-day EMA at $546. Most significant is how the 20-day EMA transformed from stubborn resistance throughout December into reliable support – a flip that occurred precisely as the Bitwise index inclusion news hit the wires.
What stands out here is the compression between the 10-day and 20-day EMAs, now separated by just $12 compared to $45 in November. This tightening typically precedes explosive moves as trapped energy releases. The 50-day EMA at $546 now represents the red line for bulls to defend on any pullback. Loss of this level would trap recent index-driven buyers and likely trigger stops down to the 100-day EMA near $540.
Resistance Stacks Between $590-$607 as Bulls Eye Monthly Highs
Above current levels, sellers have fortified the $590-$607 zone where December highs meet multiple technical confluences. The monthly pivot R1 at $590 marks the first barrier, followed by the psychological $600 level that rejected advances twice last month. Most challenging is the monthly high at $607.35, which aligns with the 161.8% Fibonacci extension from November’s correction – a magnet for profit-taking.
Bulls can draw confidence from the support architecture building beneath. The immediate floor sits at $563 where the 20-day EMA converges with the weekly pivot point. Below that, the $546-$555 zone offers multiple safety nets including the 50-day EMA, the January monthly pivot, and the range BCH defended throughout late December. This week’s surge above $575 while broader markets struggled demonstrates genuine relative strength.
Market structure reveals an inverse head-and-shoulders pattern building since November, with the neckline at $590. A decisive break above this level would project a measured move toward $640, aligning with the monthly R2 pivot. The pattern gains credibility from the volume surge accompanying BCH’s inclusion in institutional index products – suggesting this isn’t just technical traders painting the tape.
Bulls Require Close Above $590 to Unlock $640 Target
Should BCH secure a daily close above $590, the path clears toward $640 where the inverse H&S measured move meets quarterly resistance. Bulls need sustained momentum above the neckline while institutional flows from the Bitwise fund provide ongoing bid support. The 40% outperformance versus other L1s positions BCH as a momentum leader entering traditionally strong Q1 seasonality.
The bearish scenario triggers if price fails at $590 and breaks back below $563 on volume. Such a rejection would complete a triple top formation, likely flushing positions down to $520 where the 100-day EMA offers distant support. This outcome grows more probable if broader crypto markets turn defensive or if whale wallets that accumulated in the $555-$575 range begin distributing.
Given BCH’s relative strength leadership and the technical setup coiling above key EMAs, the highest probability path sees consolidation between $575-$590 before another assault on $600. The institutional validation from index inclusion should limit downside while bulls gather energy for the next leg higher. Watch for a weekly close above $590 to confirm the inverse H&S breakout.