Arbitrum Tests Critical Support as Layer-2 Token Battles Through 18.7% Weekly Decline
Market Structure Shifts Lower
- ARB slides 18.7% this week, touching $0.2107 as Upbit deposit suspension impacts liquidity
- Technical indicators flash mixed signals with RSI at 44.16 showing oversold bounce potential
- Support at $0.1864 remains untested despite bearish momentum dominating daily timeframes
Arbitrum’s native token ARB has endured a devastating drop of 18.7% over the past week, with price action tumbling from recent highs to settle at $0.2107. The sell-off accelerated after Upbit’s unexpected deposit suspension announcement hit the wires, triggering stop-loss cascades that pushed the token down through multiple support levels. The main question for traders is: can ARB defend the critical $0.1864 monthly low, or will liquidity concerns drive another leg lower?
| Metric | Value |
|---|---|
| Asset | ARBITRUM (ARB) |
| Current Price | $0.21 |
| Weekly Performance | 4.05% |
| Monthly Performance | -18.75% |
| RSI (Relative Strength Index) | 44.2 |
| ADX (Average Directional Index) | 33.8 |
| MACD (MACD Level) | -0.01 |
| CCI (Commodity Channel Index, 20-period) | -42.91 |
RSI Drops to 44.16 – Room for Further Decline Before Oversold Territory
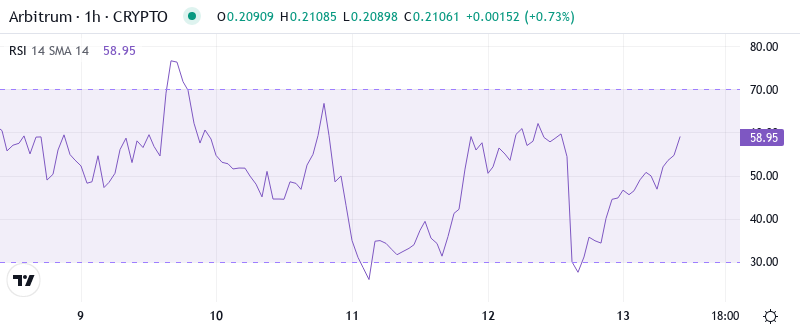
Reading the oscillator at 44.16 on the daily timeframe, traders see a momentum picture that’s weakened significantly but hasn’t yet reached capitulation levels. The RSI index currently sits in neutral-to-bearish territory, having fallen from above 50 just days ago as selling pressure intensified following the Upbit news. This positioning leaves room for additional downside before hitting the oversold threshold at 30, where bounce trades typically emerge.
What’s revealing is how RSI behaved during previous ARB corrections – similar readings near 44 in October preceded another 15-20% decline before finding a sustainable bottom. So for swing traders, this balanced-but-weakening RSI suggests patience is warranted before attempting any knife-catching entries, especially with the deposit suspension still creating uncertainty around near-term liquidity flows.
ADX at 33.8 Confirms Strong Bearish Trend Taking Control
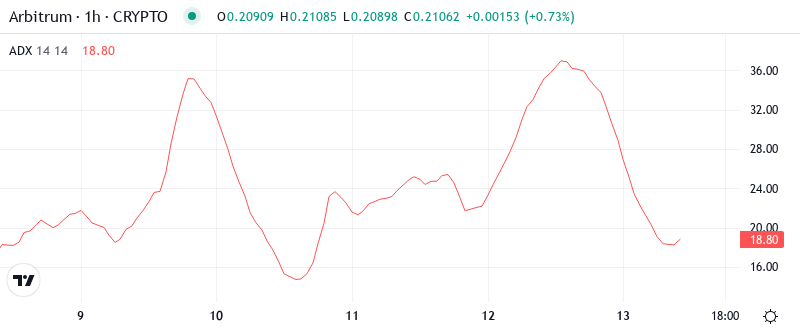
At the level of 33.8, the ADX entry indicates that the trend is gaining serious power and approaching extreme readings. Basically, being in this zone above 30 tells us that sellers have convincing control of the tape, with the directional movement showing clear bearish dominance as evidenced by the -DI reading of 25.88 substantially exceeding the +DI at 14.56.
Since ADX climbed from the mid-20s earlier this week, the market has transitioned from choppy consolidation to a defined downtrend. Therefore, day traders should suit their strategies to this change – favoring short-side setups on rallies rather than trying to pick bottoms while trend strength remains this elevated. The Upbit suspension appears to have been the catalyst that pushed ADX through 25, transforming market structure from range-bound to trending.
20-Day EMA at $0.2165 Flips to Resistance After ARB Loses Key Average
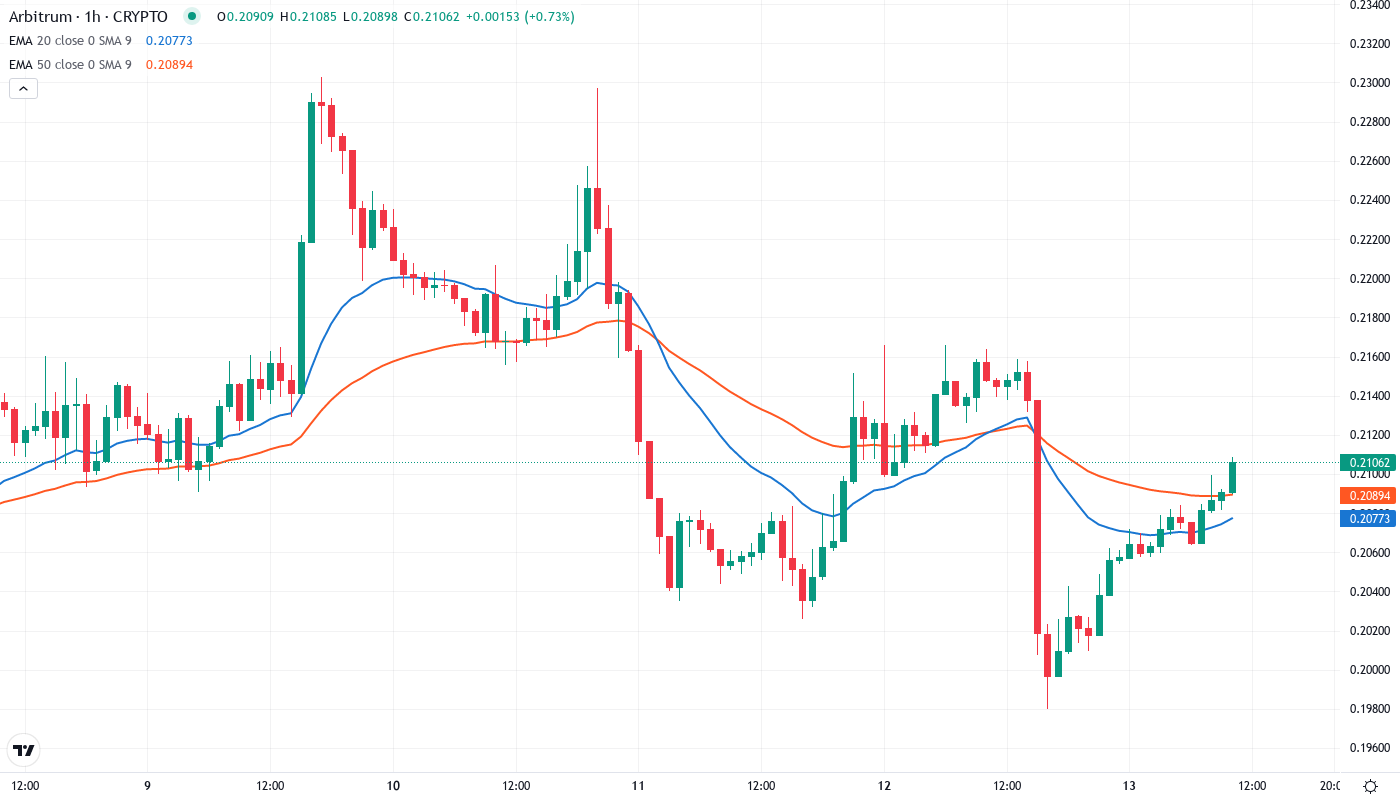
Looking at the moving average structure reveals a bearish configuration taking shape. ARB currently trades below both the 10-day EMA at $0.2118 and more importantly, the 20-day EMA at $0.2165, which had provided support during the early December consolidation. This level rejected advances twice yesterday as trapped bulls attempted to reclaim lost ground following the initial Upbit-driven selloff.
Price action shows the 50-day EMA looming as distant resistance at $0.2511, roughly 19% above current levels – illustrating just how far ARB has fallen in this recent cascade.
That former support area at $0.2165 now transforms into a red line for the bears to defend on any relief bounces. The fact that ARB couldn’t reclaim this level despite CryptoProcessing’s positive integration news suggests sellers remain firmly in control of the narrative.
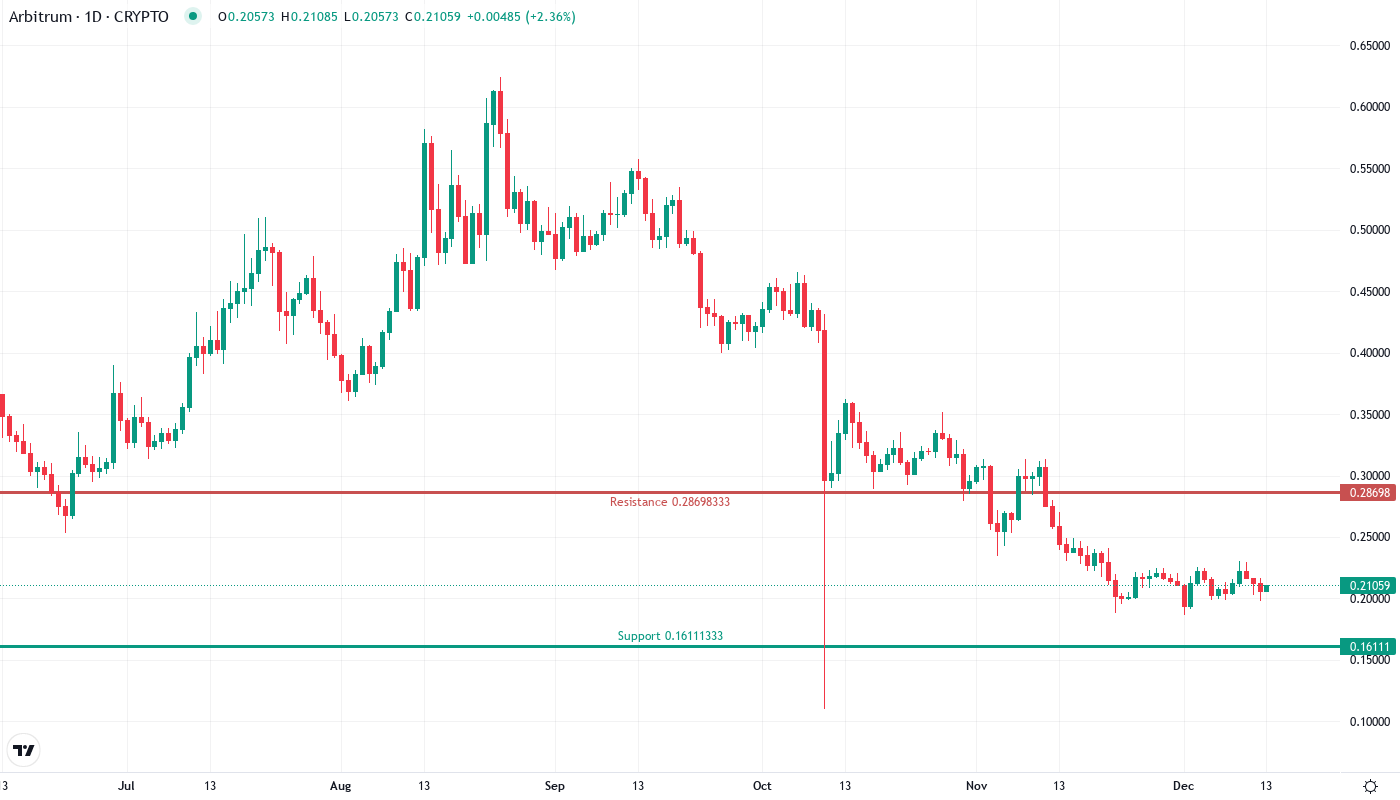
Monthly Low at $0.1864 Becomes Make-or-Break Support Zone
Above current price, sellers have stacked resistance at multiple confluent levels. The immediate resistance zone spans from $0.2165 (20-day EMA) up to $0.2260 (30-day EMA), creating a formidable barrier that’s already rejected two rally attempts. December highs near $0.2491 mark the next major resistance cluster, coinciding with the monthly pivot point.
Bulls defend their final stronghold at the $0.1864 monthly low, which has held as support throughout December’s volatility. This level gains additional significance as it represents a 25% discount from the weekly high at $0.2491, typically an area where value buyers emerge in crypto markets.
The weekly timeframe shows this support tested multiple times since November without a decisive break.
Crucially, the price architecture shows seller dominance as long as ARB remains below $0.2165. The structure suggests further downside probes toward $0.1864 are likely, especially with the ADX confirming trend strength and the Upbit situation still unresolved. Only a volume-driven reclaim of the 20-day EMA would shift near-term momentum back toward neutral.
Bears Target $0.1864 as Liquidity Concerns Weigh on Recovery Attempts
Bulls require a decisive close above $0.2165 to neutralize the immediate bearish pressure and open a path toward $0.2260 resistance. Should ARB manage this feat while the CryptoProcessing integration gains traction, targets would extend to $0.2511 where the 50-day EMA caps upside potential.
The bearish domino falls if price breaks below $0.1864 on volume – this would trap recent dip buyers and likely trigger a flush toward $0.15 or lower. Such a breakdown becomes increasingly probable if the Upbit deposit suspension extends beyond initial expectations, further constraining ARB’s liquidity profile.
Given the technical configuration and ongoing exchange uncertainty, the most likely short-term path is for ARB to probe the $0.1864 support within the next 48 hours. Whether this level holds will largely depend on how quickly the Upbit situation resolves and whether new positive catalysts emerge to offset the liquidity headwinds currently dominating price action.