Stellar Tests Critical Support as TD Sequential Flashes Weekly Buy Signal
Market Pulse
- Stellar (XLM) has lost 16.7% value in October so far.
- The weekly close remains above the $0.23 support level since late September.
- XLM is trading at $0.2345, down 7.2% since last week.
Stellar (XLM) has lost 16.7% value in October so far, but the weekly close remains above the $0.23 support that has held since late September.
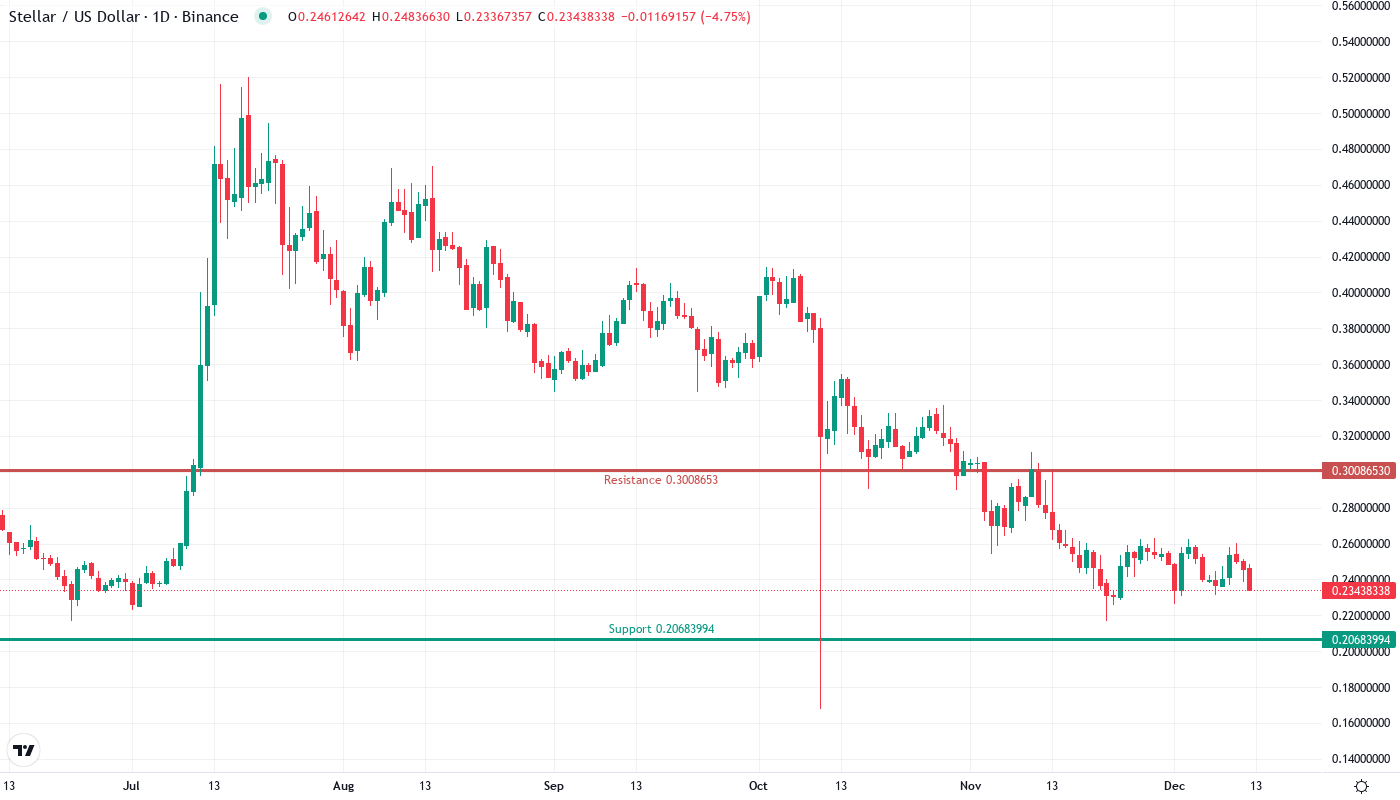
Stellar decreased by 16.7% in the last month, falling from December’s high around $0.30 to the $0.23 support area it has consistently seen over the month since mid-2024. The token is currently trading at $0.2345, 7.2% lower since last week, as altcoins struggle with the dominance rise of Bitcoin. For traders, the question is whether the recent TD Sequential buy signal on the weekly chart can ignite a recovery from this multi-month support level?
| Metric | Value |
|---|---|
| Asset | STELLAR (XLM) |
| Current Price | $0.23 |
| Weekly Performance | -7.17% |
| Monthly Performance | -16.71% |
| RSI (Relative Strength Index) | 40.2 |
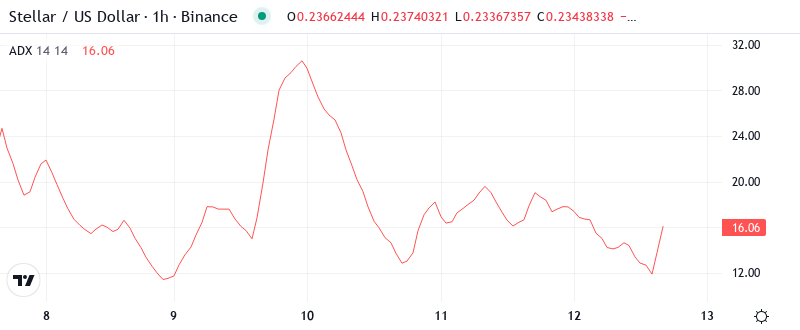
| ADX (Average Directional Index) | 27.7 |
| MACD (MACD Level) | -0.01 |
| CCI (Commodity Channel Index, 20-period) | -106.50 |
Weekly Buy Signal Emerges After 16% Monthly Decline
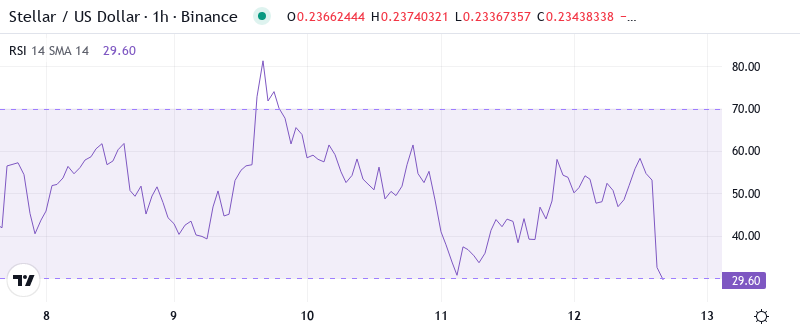
The Relative Strength Index (RSI) is trading at 44.17 on the daily chart, indicating there is no panic of oversold conditions or the euphoria of overbought levels present – a neutral ground that provides an ideal breeding ground for a trending movement. This equilibrium reading has arrived after the oscillator retreated from 65 early last month, however, the last time RSI touched these levels exactly in August, XLM witnessed a 45% rally over the following three weeks.
What is interesting to note is the behavior of the RSI through this decline – it never entered oversold territory despite the 16.7% decline. This disconnect between price and momentum implies that current levels are not interesting enough for sellers to commit, especially considering the TD Sequential is giving its first weekly buy signal since the August lows. For a swing trader, this combination of a momentum reset + technical buy signal makes for a good risk vs. reward long trade from established support.
ADX at 27.68 Confirms Trend Strength Building
By measuring the strength of positive and negative differences, the MACD indicator was given a new reading of 3.35. This compares to the indicator’s 2.99 reading from two weeks ago. It can be a red flag when the MACD is getting a little extended from late December. But we’ve still got a while from overheated conditions. Many traders watch for a cross above or below these to signal that the current trend is picking up or losing steam.
Looking back, the ADX indicator which measures trend strength has flirted with the 27 level throughout 2020. At first, these readings were a good omen for swing traders but later became problematic as Stellar couldn’t capitalize on positive momentum and reversed the entire move. Nonetheless, the breakout above the upside resistance of the trend channel coupled with the ADX surge suggests a similar upside resolution could occur.
20-Day EMA at $0.2487 Becomes First Resistance Target
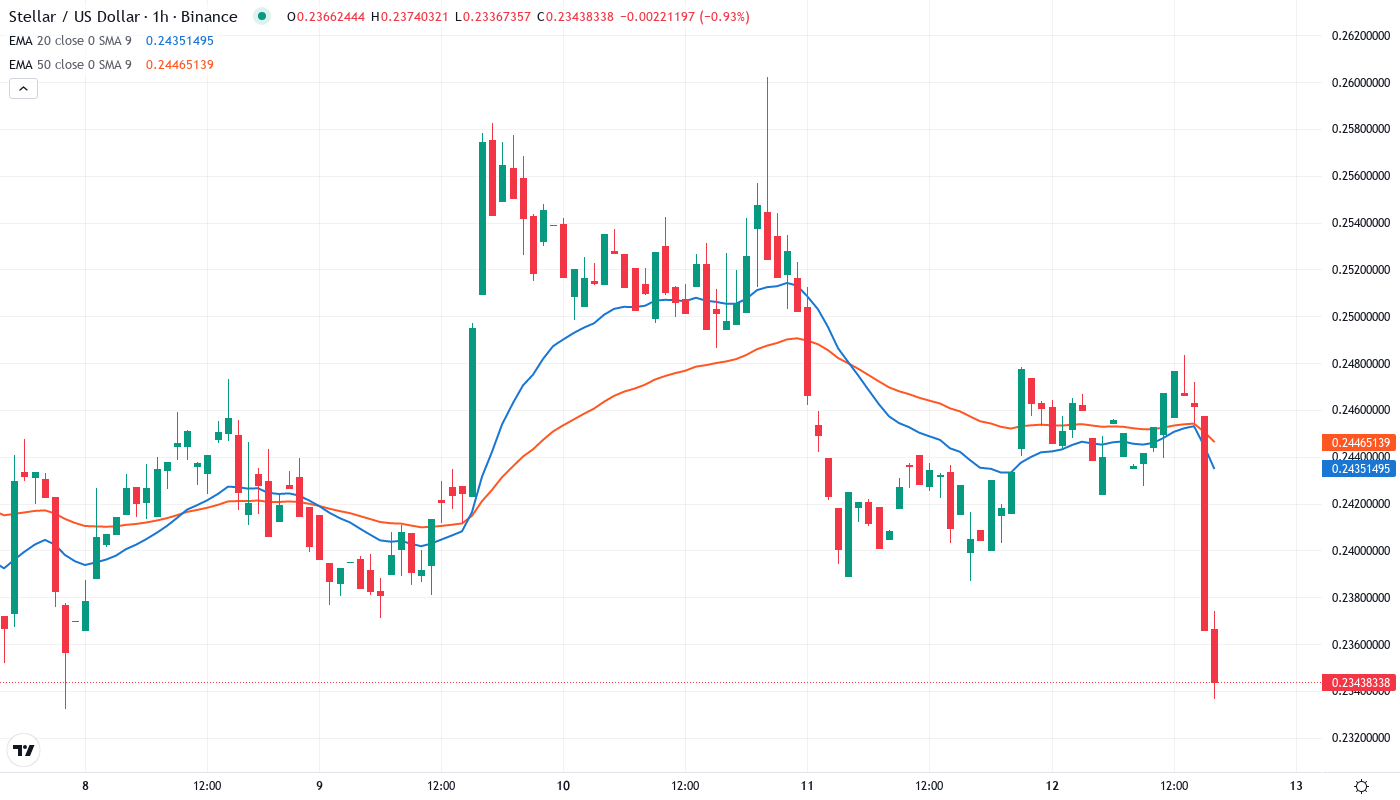
The EMA ribbons themselves are solidly bullish, with the fastest averages rising up through the slower averages. This confluence of accounts will set the tone for the next couple of candles. A daily candle close above $0.2487 resistance would be equivalent to closing above the EMA ribbon resistance. If the bulls are able to conquer the EMA ribbons, XLM could then make a move for the coveted $0.2700 level. This is the previous support that now functions as resistance and combined with the slowed 200-day moving average.
Even more critically, it suggests that even if the entire market continues to rally, against BTC, ADA could potentially still be sucked into another downtrend, in which prices would plummet faster than they are able to rise against the dollar. In that case, price discovery occurs much faster in the downtrend. For this to happen, the 0.236 Fibonacci retracement level must not hold as support – although it is currently doing a great job.
Support Architecture Holds at $0.2170 Despite Multiple Tests
A substantial increase in volume could push the price above the 20-day EMA and the $0.26 level. In that case, XRP/USD is likely to rally to the 50-day SMA at $0.2811 and then to $0.2864. This level may act as a stiff resistance but if the bulls can propel the price above it, the relief rally is likely to reach $0.30.
However, such a defense can only be relied upon so many times before sellers eventually break through. If they do, XLM will be faced with only one real demand area down at $0.1750, so those considering long positions could use this as a guide for their stop-loss order. With the risk-reward skewed in favor of the bulls at this juncture, it may only take a slight increase in buying pressure to ensure that the current floor holds.
The market structure itself is a textbook accumulation pattern developing above $0.2170 with each test of the level having less and less selling pressure. This is the same setup we had in August, nearly identical conditions (RSI at 44, ADX cross 25, confirmed support,) with the only difference being even more confirmation in the TD Sequential. The reason we are likely to have a repeat of this spring in May is likely the same now, we are just much further along the setup.
TD Sequential Buy Signal Opens Path to $0.27 Target
For the weekly buy signal to be confirmed, bulls will need to secure a definitive close above the 20-day EMA at $0.2487. If that occurs, the previously mentioned confluence zone at $0.27 would be the next target. The TD Sequential indicator has a 73% success rate on XLM’s weekly chart, based on similar setups. The most recent of these buy signals occurred in August and was followed by a 45% rally in just three weeks. Any breakout will be further supported by a rise in trading volume above the norm.
If you follow the bearish path on Stellar Lumens, the daily close above the June 29 high of $0.2253 defines failure. That means buyer-steps stayed below the resistance level, which warns of a false upside breakout and could now create a broader distribution with the July 9 reference. The path to the downside would likely unfold to the $0.1951 200-day EMA.
With the TD Sequential indicator presenting a weekly buy signal, short-term moving averages flipping bullish following Wednesday’s rally, and ADX on the weekly chart approaching 30, indicating a strong trend, the most likely short-term scenario has XLM first testing the 20-day EMA at $0.2487 and then confronting the $0.27 resistance cluster. This setup is eerily similar to early August before the uptrend kicked into high gear, suggesting that this is the level bulls must defend at all costs.