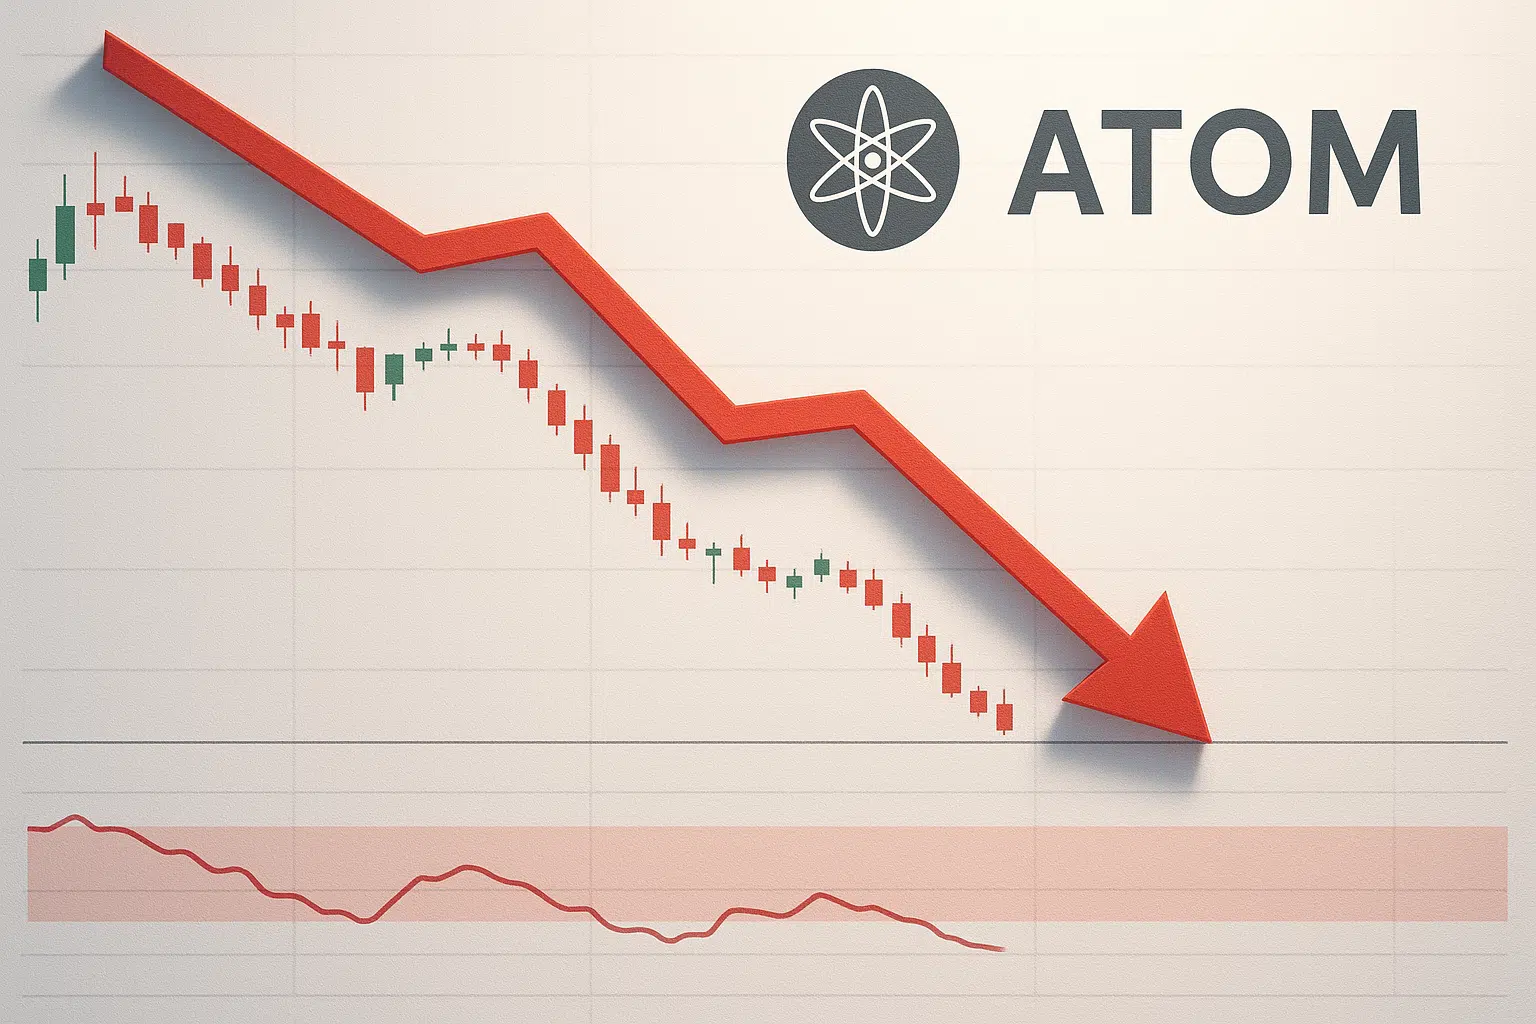
ATOM Dives to Multi-Year Lows as RSI Hits Extreme Oversold Territory
Market Structure Shifts Lower
- ATOM trades at $2.19, marking a devastating 75% collapse from yearly highs
- RSI plunges to 35.5 on the daily timeframe – the most oversold reading since March 2020
- ADX climbs above 29, confirming genuine downtrend momentum behind the selloff
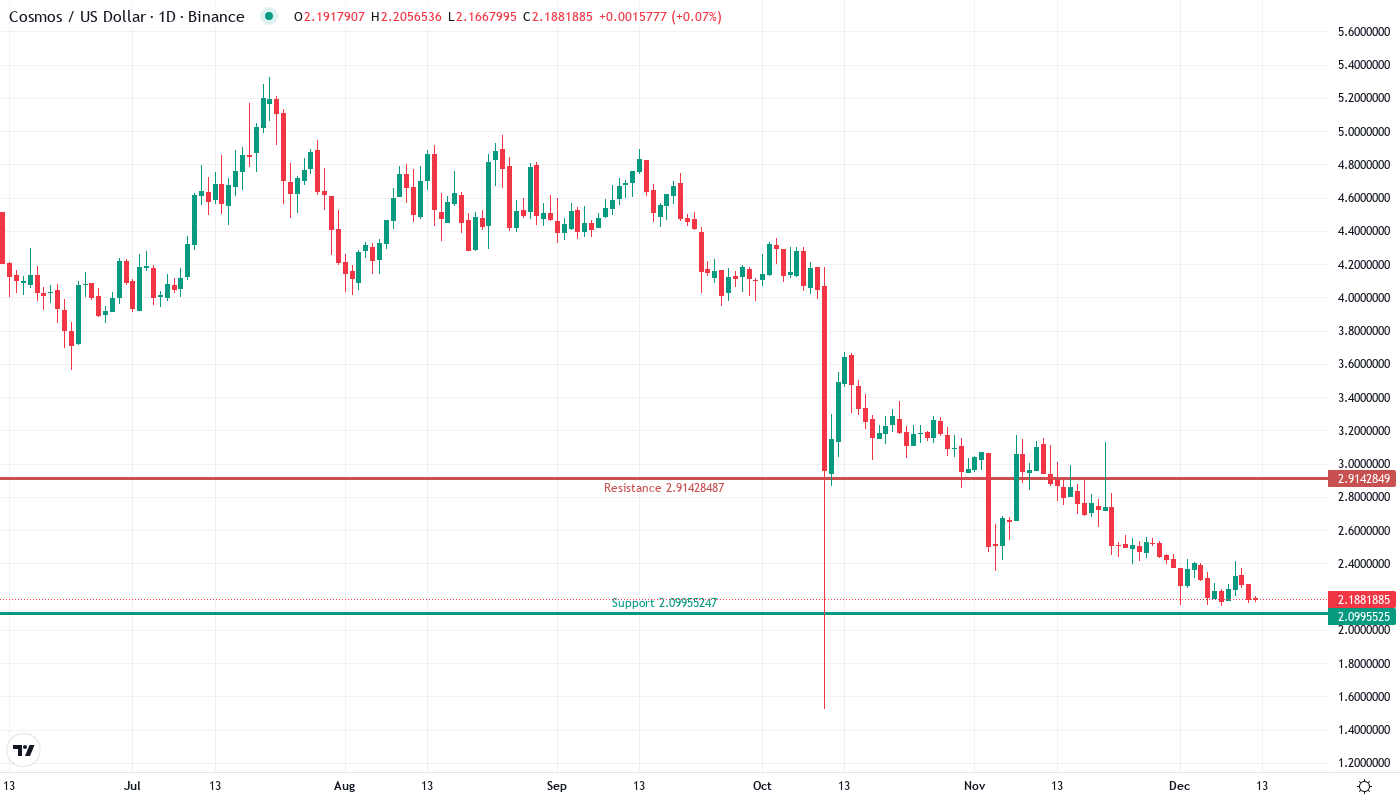
Cosmos has delivered one of crypto’s most devastating performances this year, with ATOM shedding 25.5% in the past month alone to trade at $2.19 – a level not seen since the depths of the 2022 bear market. The coin’s 75% yearly decline stands out even in a market where other major altcoins have found their footing, with the recent Cronos ecosystem developments failing to stem the bleeding despite increased visibility for the broader Cosmos network. The main question for traders is: have we finally hit capitulation levels, or does this mature downtrend have further to run?
| Metric | Value |
|---|---|
| Asset | COSMOS (ATOM) |
| Current Price | $2.19 |
| Weekly Performance | -5.34% |
| Monthly Performance | -25.53% |
| RSI (Relative Strength Index) | 35.5 |
| ADX (Average Directional Index) | 29.2 |
| MACD (MACD Level) | -0.14 |
| CCI (Commodity Channel Index, 20-period) | -106.56 |
RSI Plunges to 35.5 – Matches March 2020 Capitulation Levels
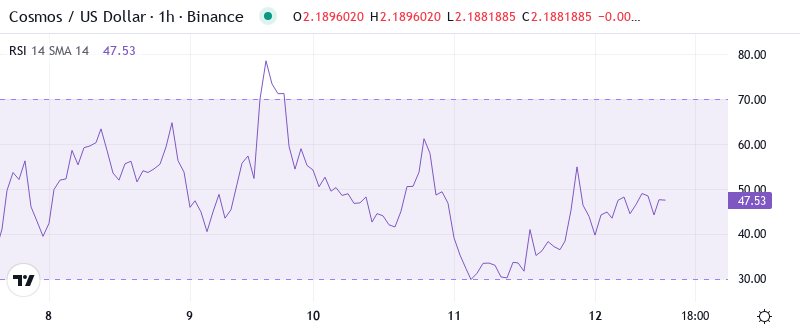
RSI sits at 35.54 on the daily timeframe, marking the deepest oversold condition ATOM has experienced in nearly four years. This extreme reading typically signals seller exhaustion, though it’s worth mentioning that oversold can stay oversold in strong downtrends – and ATOM has certainly proven that thesis lately. The weekly RSI paints an even grimmer picture at 27.7, confirming that this isn’t just a short-term flush but rather sustained distribution across multiple timeframes.
What’s revealing is how RSI behaved during the recent Cronos Labs announcements – it barely budged from oversold territory despite the ecosystem developments, suggesting fundamental catalysts alone won’t reverse this technical damage. So for swing traders, this deeply oversold condition presents a classic risk-reward setup: either we’re witnessing peak capitulation that historically marks major bottoms, or the selling pressure remains so intense that oversold bounces get immediately sold into.
ADX at 29.2 Confirms Mature Downtrend Still Has Conviction
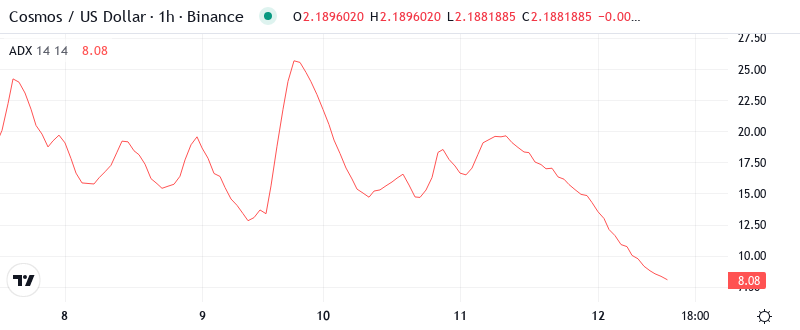
At the level of 29.2, the ADX entry indicates that the downtrend maintains serious momentum – this isn’t some choppy consolidation but rather directional selling with conviction. Basically, when ADX reads above 25 during a downtrend, it tells us bears remain firmly in control and counter-trend trades carry elevated risk. The monthly timeframe shows ADX at an even more extreme 37.16, underlining how entrenched this bearish trend has become across all time horizons.
Looking at trend strength, the current configuration suggests we’re transitioning from simple selling to potential capitulation – ADX readings near 30 during multi-month downtrends often coincide with climactic bottoms. Therefore, day traders should suit their strategies to this volatile environment: quick scalps on oversold bounces rather than trying to catch the falling knife, while position traders might start building watchlists for when ADX eventually rolls over below 25, signaling trend exhaustion.
Price Trapped Below Entire EMA Ribbon Since October
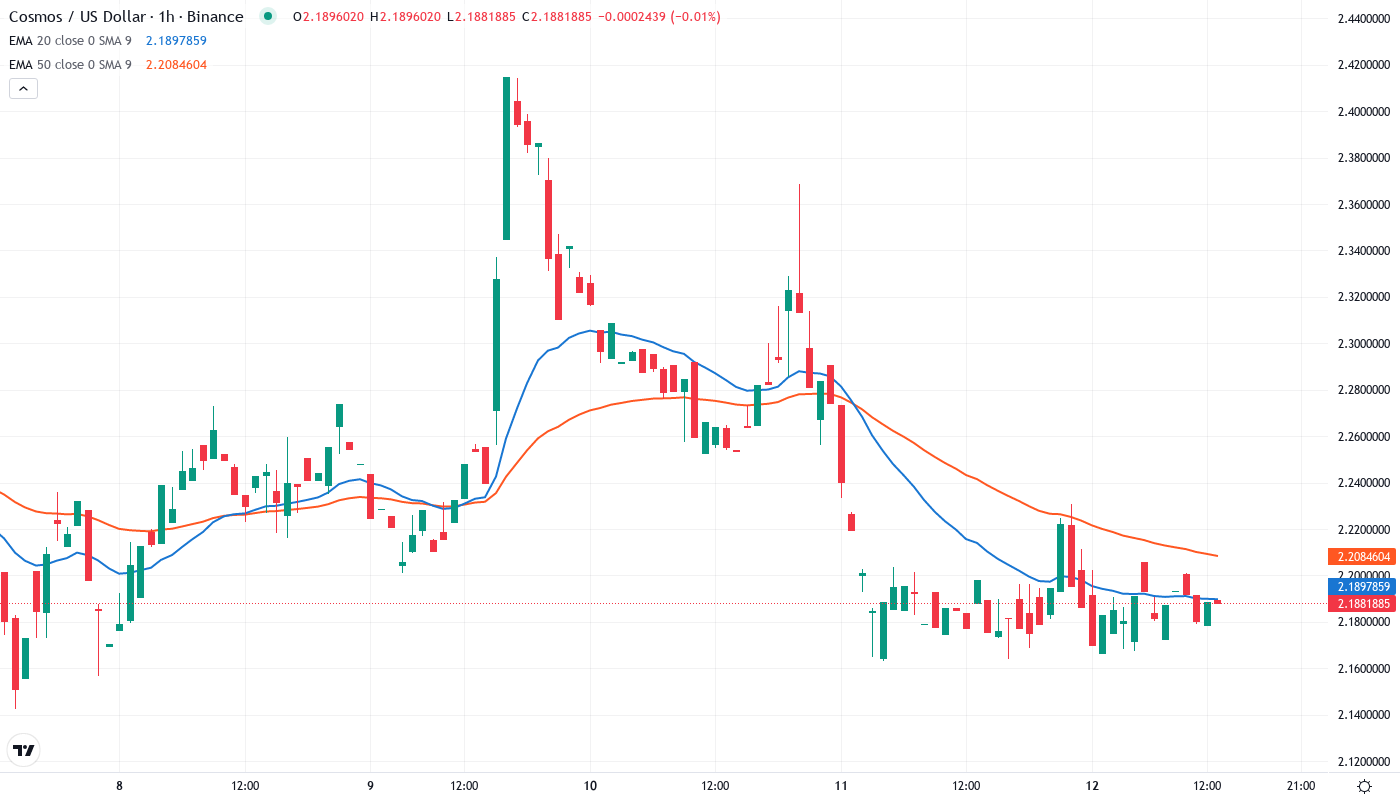
Price action through the EMA ribbons tells a devastating story – ATOM trades below every single moving average from the 10-day ($2.26) all the way up to the 200-day ($3.72). The 50-day EMA at $2.69 now sits 23% above current price, creating a massive overhead resistance zone that bulls need to reclaim just to shift the intermediate trend. Most telling is how the 20-day EMA at $2.36 has acted as a brick wall on three separate relief attempts since November, rejecting each bounce with increasing violence.
What’s significant is the compression between the 10-day and 20-day EMAs – they’re converging toward $2.30-$2.36, creating a critical resistance cluster. This level rejected advances during both Cronos-related news events, proving that technical resistance trumps fundamental catalysts in established downtrends. The 200-day EMA at $3.72 remains so distant it’s almost irrelevant for near-term trading decisions – that’s the reality of how far ATOM has fallen from grace.
Support Evaporates Below $2.10 While Resistance Stacks Heavy Above $2.50
The immediate resistance clusters between $2.36 (20-day EMA) and the psychological $2.50 level, where December’s failed breakout attempt created a double top pattern. Above that, sellers have stacked orders at the monthly pivot of $2.63 and the 50-day EMA at $2.69 – essentially creating multiple ceilings that would take significant buying power to breach. Each of these levels has proven its effectiveness during the past month’s decline, transforming from support to resistance as the structure deteriorated.
Bulls defend what little support remains at $2.10 – roughly matching the weekly low – but the concerning reality is there’s an air pocket below to the yearly low of $2.04. Once that level breaks, we’re looking at 2022 bear market lows near $1.80 as the next potential floor. The monthly S1 pivot at $1.82 aligns perfectly with those historical levels, suggesting that’s where larger buyers might finally step in if current support fails.
This configuration resembles a textbook distribution pattern – lower highs since October, support levels failing one by one, and each bounce getting sold more aggressively than the last. The structure only improves for bulls if they can reclaim and hold above $2.36 on a daily close, which would at least put the 20-day EMA back into play as potential support rather than resistance.
Bulls Need Miracle Close Above $2.36 to Halt Freefall
Bulls require a decisive close above $2.36 to even begin discussing trend reversal – until then, every bounce remains a shorting opportunity for bears. The technical setup needs more than just Cronos ecosystem developments; it demands either a massive sector rotation into Cosmos-based projects or capitulation volume that finally exhausts the remaining sellers. Without breaking the 20-day EMA, ATOM likely continues grinding lower toward that $1.80-$2.04 zone.
The bearish scenario accelerates if $2.10 support breaks on volume – that would trigger stop-loss cascades from trapped longs and likely flush price straight to $1.80 without much resistance. Given that RSI has remained oversold for weeks without meaningful bounces, the selling pressure shows no signs of exhaustion despite extreme readings. This would trap recent bottom-fishers who bought the Cronos news, creating additional overhead supply.
Taking into account the mature downtrend (ADX above 29), oversold conditions that won’t bounce, and complete lack of technical support until $1.80, the most probable path is continued bleeding toward yearly lows. ATOM needs either complete seller exhaustion or a fundamental catalyst far stronger than peripheral ecosystem news to reverse this devastating multi-month decline.