Filecoin Plunges 37% Monthly as Onchain Cloud Launch Fails to Halt Bearish Momentum

Market Structure Shifts Lower
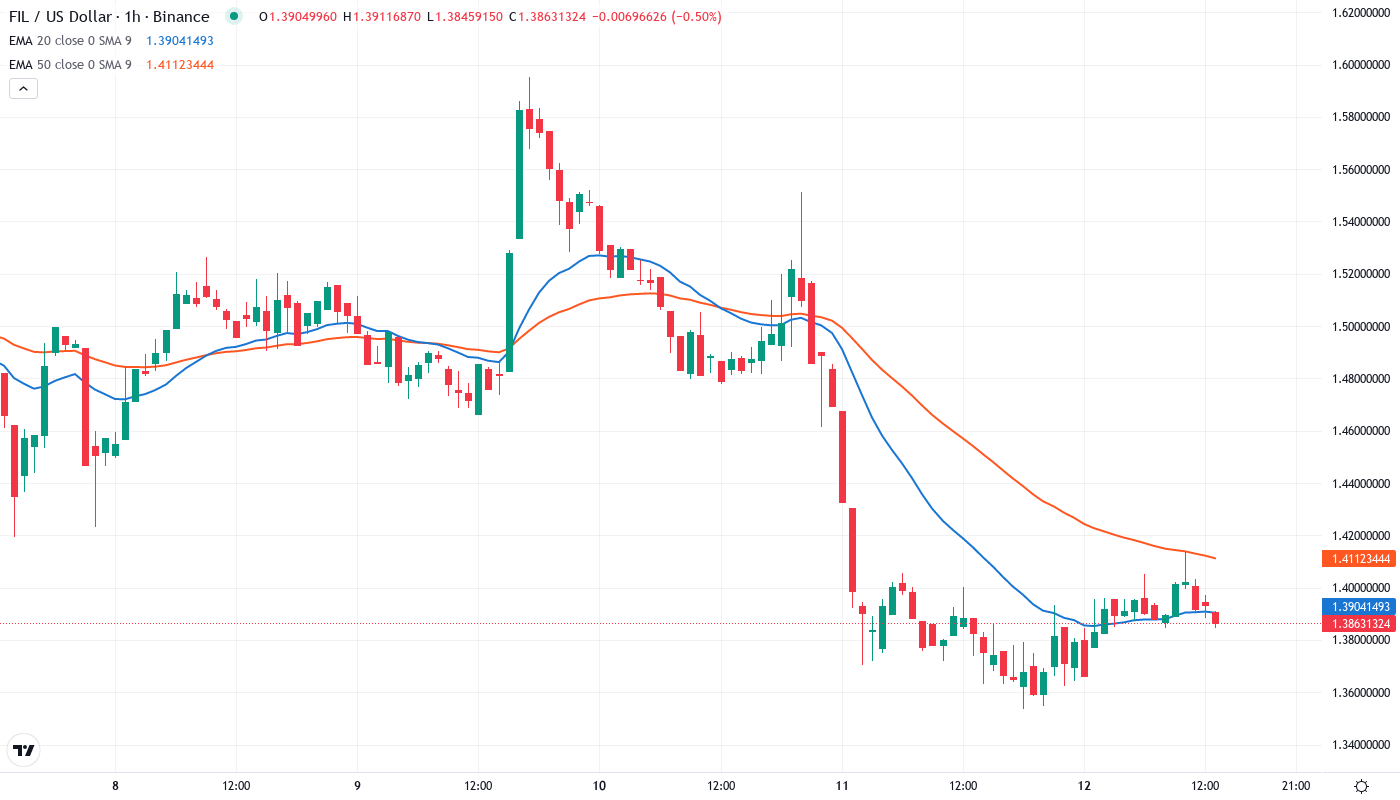
- FIL trades at $1.39, down 37.9% over the past month
- Price remains below all major EMAs with sellers in control
- Key support at $1.35 facing its sixth test this month
Despite new infrastructure developments, FIL trades at $1.39, down 37.9% over the past month. The Onchain Cloud launch has provided a fundamental catalyst, however, the price is still stuck below all major EMAs. With sellers in control, key support at $1.35 is facing its sixth test this month.
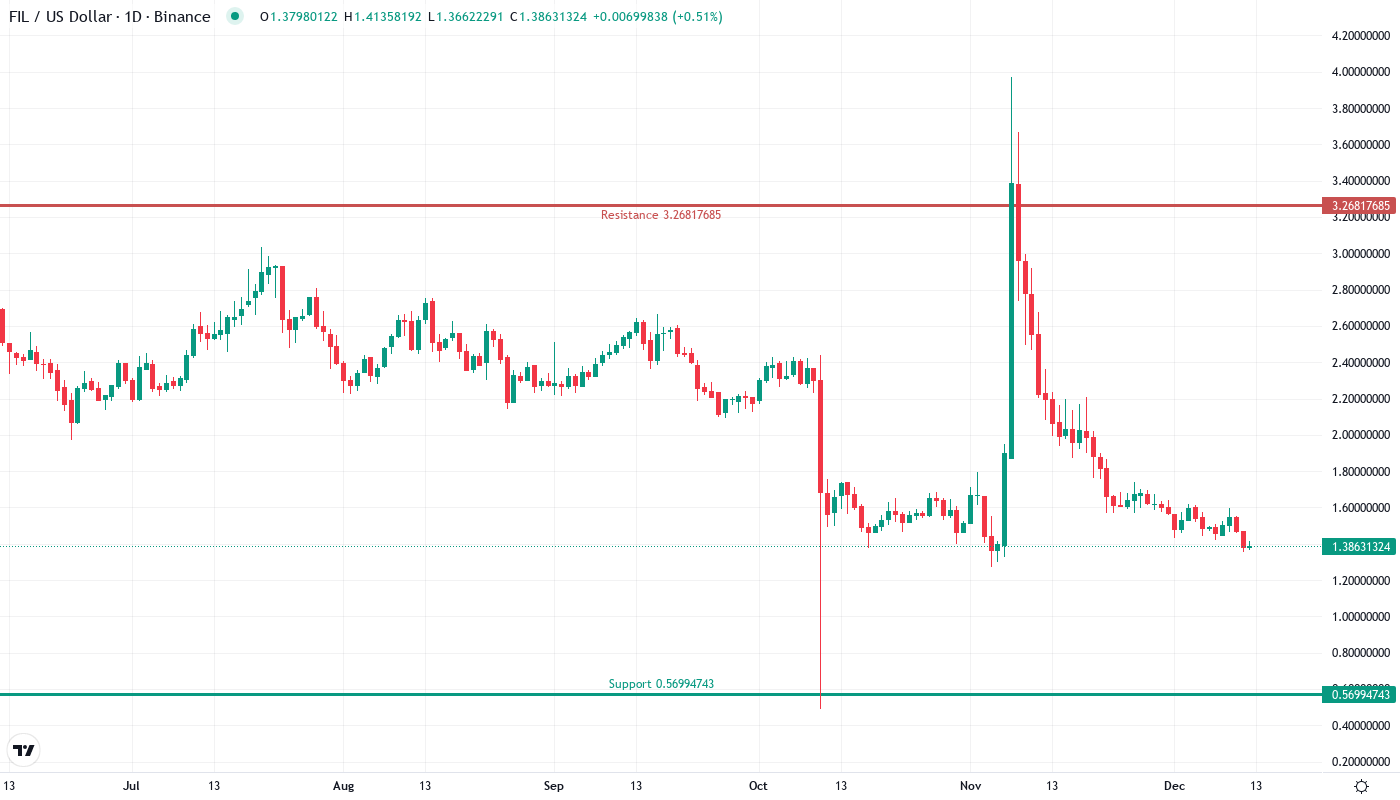
The recent precipitous plunge from November’s $2.23 high to approximately current levels around $1.39 has crushed 37.9% off FIL’s monthly price, essentially wiping a whole $0.85 per coin off the table despite the introduction of Filecoin Onchain Cloud and its game-changing decentralized infrastructure launch. The verifiable, developer-owned cloud platform was introduced during the harshest of market climates as FIL bled 10.4% this week alone, leaving no respite for bulls and preventing any meaningful bid from developing. The primary question facing traders at this juncture becomes: will this fundamental hook finally stop the exceptionally bearish bleeding or will the loose technicals spoil any good cheer?
| Metric | Value |
|---|---|
| Asset | FILECOIN (FIL) |
| Current Price | $1.39 |
| Weekly Performance | -10.39% |
| Monthly Performance | -37.88% |
| RSI (Relative Strength Index) | 37.0 |
| ADX (Average Directional Index) | 13.5 |
| MACD (MACD Level) | -0.11 |
| CCI (Commodity Channel Index, 20-period) | -150.17 |
RSI at 43 Signals Neutral Territory After Month-Long Capitulation
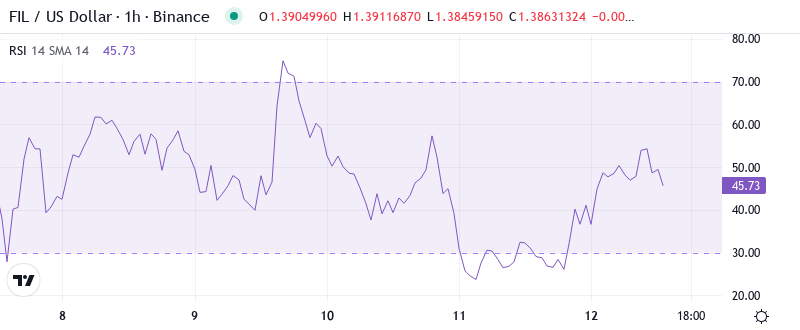
With the oscillator currently reading 43.02 on the daily timeframe, momentum looks to have at last settled after a month of persistent downside pressure which saw RSI slump as low as 32.3 (a level not seen since the August market-wide purge). A neutral number implies the immediate downside momentum wane is over, however RSI has yet to properly recover in a potential move to signify buyers may be re-entering the market. For the swing trader, both longs and shorts remain a possibility with the current neutral momentum, however the lack of a bullish divergence following the Onchain Cloud news release would tell us that the current narrative remains in control of the sellers.
What is interesting is the behavior of the Relative Strength Index (RSI) during the infrastructure announcement the week of March 31st—barely moved from oversold levels when the news broke. A similar RSI set-up in late September led to an additional 15% decline before price percolated higher. That said, lest you believe the coast is clear to short with abandon, RSI would need to get back above and hold the 50 level. The weekly RSI at 39.95 confirms the intermediate-term negative momentum picture.
ADX at 13.46 Confirms Choppy Conditions Persist
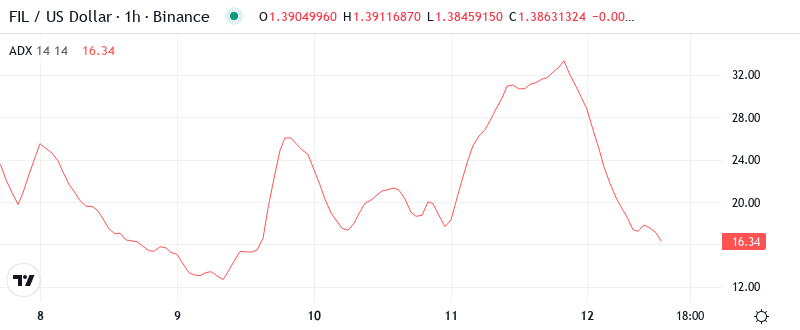
Overall, the average directional index (ADX) is a highly effective trend strength and directional bias gauge if you remember to consider it as a standalone indicator, rather than the cornerstone in your trading approach. With ADX hovering below trending thresholds on too many charts to count right now, independent traders are not the only ones staring at their screens in frustration.
In other words, the signal-to-noise ratio is very low right now based on the ADX thus traders will find themselves stopped out rather than caught in trending opportunities. The flurry of spikes intramonth also made the opportunities scarce. Given the continuously depressed ADX, this may continue throughout the month of June.
Price Trapped Below Entire EMA Ribbon Since Early December
Analyzing the moving average structure, we can see a bearish configuration since FIL is trading below all key EMAs. In fact, the price is below the 10-day ($1.48), 20-day ($1.56), 50-day ($1.73), and most importantly the 100-day EMA ($1.91), acting as strong resistance. The 50-day EMA resistance level blocked three attempted advances in December before the Onchain Cloud announcement, making it the level that bulls need to break to alter market sentiment.
The most telling relationship is the compression between price and the 10-day EMA, with only a 6.5% gap in prices there to give any relief bounce it meets immediate selling pressure. We already discussed the support defined by the 50-day EMA was erased and is now resistance. The EMA 200 is way overhead at $2.24—some 61% above the current price, underpinning how deeply underground this downtrend has thrust the technicals.
Monthly Low at $1.35 Becomes Critical Support After Six Tests
There is strong resistance to advancing beyond $1.55 to $1.73, with the 20-day and 50-day EMAs coming together with December’s support break. The monthly pivot point of $1.78 showcases another resistance. As a result, it forms a cluster of resistance which would be difficult to pierce without an enormous volume. Additionally, the 100-day EMA region around the psychological $2.00 level is expected to curb resurging attempts on the higher side.
Buyers are finding less resistance pushing higher with the 10-day being cleared but the pair remains beneath the 20 and 50-day EMA. These should be considered as resistances along with the 21-day EMA and volume profile building node from $1.50 – $1.57. The pair has recovered within the bull market support band of $1.10 – $1.45 making pause around here likely. Currently, resistance is tough overhead but undefined on a breakout which could be fast.
The market structure is showing a tight trading range between $1.35 and $1.55 that looks like a coiled spring. With the Onchain Cloud in operation although costs have been unreactive, players will need to look out for an inflexible cut of this range. A volume-supported transfer higher than $1.55 could push shorts toward $1.73, while $1.35 inverts the trapdoor to crosses not even seen since 2023.
Bears Control Until Bulls Reclaim $1.55 on Volume
To get out of the weeds, bulls need to cross the stream. In this case, the $1.55 zone is tightly contested by both the onchain Cloud and the VPVR, which marks it as a high-turnover node. Above the $1.55 zone, velocity should pick up again as price discovers low-volume areas of the VPVR expressed by the volume gap mapped between $1.61 and $1.73.
If we were to see an extended flush below $1.27, the next major support wouldn’t arrive until the $1.00-1.10 region (green bar), which encompasses the 23.6% Fib level and initial June breakout zone. Realistically though, breaking below $1.27 would likely trigger sufficient stop/loss orders to bounce the market back above it.
Due to the consistent weakness in trend strength (ADX at 13.46) and price being caught below all major EMAs, except for the Onchain Cloud catalyst, FIL’s most likely immediate path entails it grinding between $1.35-$1.55 as the market comes to grips with whether or not this infrastructure launch equates to real adoption metrics. Until there’s a high-volume breakout above or below, expect choppy conditions to persist and anger both the longs and shorts.