Mantle Surges 16% Weekly as AI Partnerships and TVL Growth Fuel Momentum
Market Structure Shifts Higher
- MNT climbs 16% over the past week, reversing December’s correction
- TVL milestone of $2.2 billion signals genuine institutional adoption
- Technical indicators reset from oversold, opening room for continuation
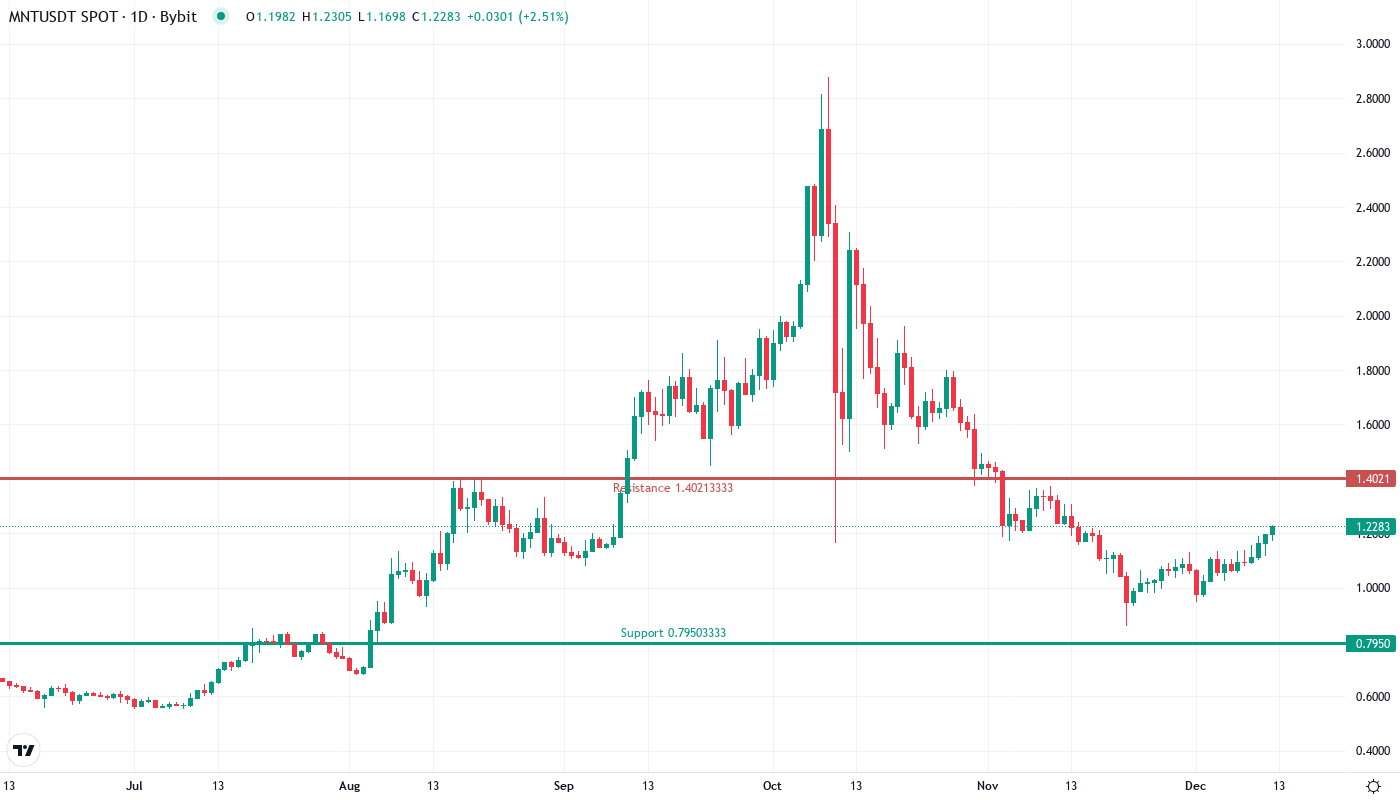
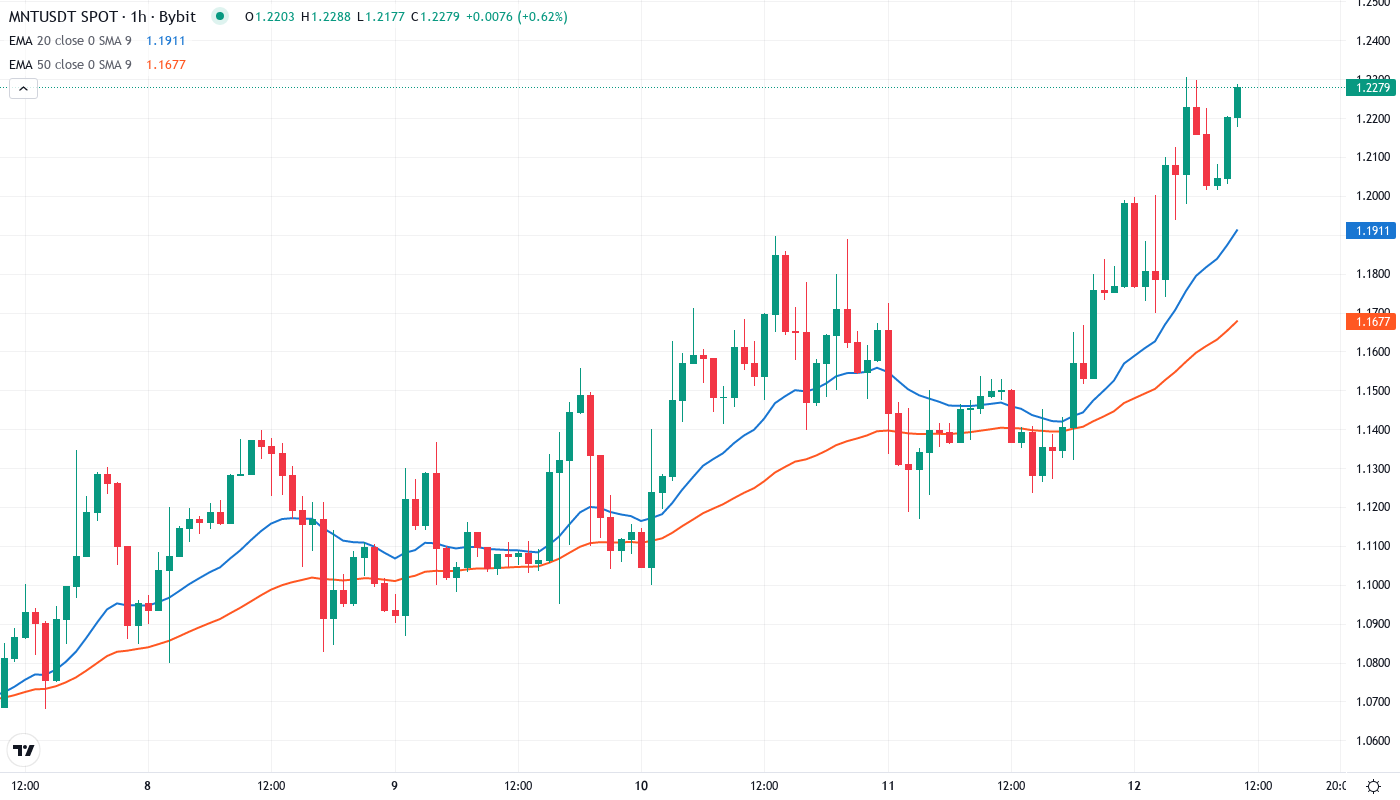
Mantle’s price action tells a compelling story of recovery this week, with MNT surging 16% to $1.226 after testing critical support near $0.86. The move comes as the protocol’s Total Value Locked reached $2.2 billion – a milestone that attracted both retail and institutional attention. Despite remaining 28.7% below its monthly high of $1.306, the cryptocurrency has convincingly broken through multiple resistance levels, kick-starting what appears to be a genuine trend reversal. The main question for traders is: can this momentum sustain as MNT approaches the psychological $1.30 resistance where December’s rally stalled?
| Metric | Value |
|---|---|
| Asset | MANTLE (MNT) |
| Current Price | $1.23 |
| Weekly Performance | 16.00% |
| Monthly Performance | -0.96% |
| RSI (Relative Strength Index) | 58.6 |
| ADX (Average Directional Index) | 19.1 |
| MACD (MACD Level) | -0.01 |
| CCI (Commodity Channel Index, 20-period) | 222.50 |
RSI Climbs From Oversold Territory – First Bullish Signal Since December Peak
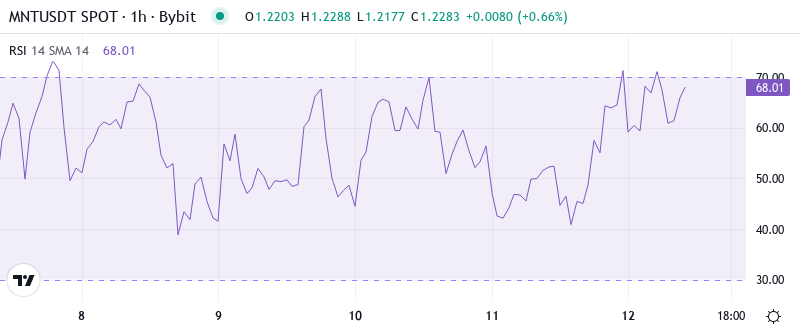
Reading the oscillator at 58.55 on the daily timeframe, traders see momentum rebuilding from oversold conditions that marked the recent bottom. The RSI configuration mirrors late November’s setup, when similar readings preceded a 40% surge toward monthly highs. Interestingly, the weekly RSI sits at 49.59, suggesting the longer timeframe remains far from exhausted despite the recent rally.
So for swing traders, this balanced RSI profile means there’s room to run before hitting overbought territory. The Bybit and Almanak AI partnership announcement coincided perfectly with RSI bouncing from 30, adding fundamental wind to the technical sails. Historical patterns show MNT typically extends rallies until RSI reaches 70-75, which translates to another 10-15% potential upside from current levels.
ADX at 19.11 Signals Early Trend Development After Month-Long Consolidation
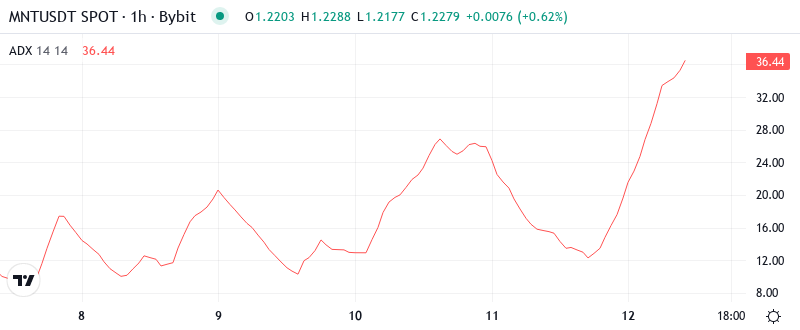
Trend strength indicators paint an intriguing picture, with ADX reading just 19.11 – still below the critical 25 threshold. Basically, MNT remains in accumulation mode rather than a full trending state, which actually favors continuation. The +DI crossing above -DI last week marked the first bullish trend signal since early December, precisely when institutional flows started returning to the ecosystem.
What’s particularly revealing is how price action accelerated once ADX began climbing from single digits. The Trump-backed firm’s announcement of RWA products on Mantle provided the catalyst for this trend awakening. Therefore, day traders should prepare for increased volatility as ADX approaches 25 – historically, MNT’s most explosive moves occur when trend strength shifts from compression to expansion phases.
20-Day EMA at $1.123 Flips From Resistance to Critical Support
Price trades decisively above the entire EMA ribbon for the first time since December’s correction began. MNT sits above the 10-day ($1.135), 20-day ($1.123), and crucially, the 50-day EMA at $1.151. The 20-day EMA changed from being a resistance level to a support one after three failed attempts in late December, marking a clear shift in market structure.
Looking at the broader moving average architecture, the 100-day EMA at $1.227 looms just overhead – essentially at current price levels. This convergence creates a natural pause point where profit-taking meets new buying interest. The 200-day EMA way down at $1.288 provides a distant magnet for any extended rally, especially if the $2.2 billion TVL milestone continues attracting fresh capital to the ecosystem.
Resistance Clusters Between $1.288 and $1.306 Define Near-Term Battleground
Above current price, sellers have stacked orders at multiple confluence zones. The immediate resistance sits at $1.288 where the 200-day EMA meets the weekly R1 pivot – a level that rejected advances twice in December. Beyond that, the monthly high at $1.306 represents the ultimate test for bulls, coinciding with psychological round numbers that attracted heavy distribution last month.
Bulls now guard the $1.078-$1.131 support zone with conviction, as evidenced by six successful defenses since late December. The monthly pivot at $1.131 transformed from resistance to support during this week’s surge, while $1.078 marks the monthly S1 level that contained December’s entire correction. Any daily close below this zone would trap recent AI partnership buyers and likely trigger stops down to $0.795.
This market structure resembles a textbook accumulation pattern – higher lows defended aggressively while resistance gets tested repeatedly. The confluence of technical support with fundamental catalysts (AI partnerships, RWA expansion, TVL growth) creates an asymmetric risk-reward setup favoring bulls in the near term.
Bulls Target $1.306 Retest as Fundamental Catalysts Stack Up
Should MNT secure a daily close above the 100-day EMA at $1.227, bulls gain confidence to attack December’s high at $1.306. The combination of AI quant strategies going onchain, expanding RWA products, and growing TVL provides the fundamental fuel for such a move. A successful break above $1.306 opens the path toward $1.488 where the weekly R3 pivot waits.
Bearish scenarios activate if price fails at current levels and drops below $1.078 support on volume. Such a breakdown would trap momentum traders who bought the AI partnership news, likely cascading toward $0.795 where the monthly S3 pivot sits. The setup invalidates entirely below $0.86 – December’s low that marked maximum pessimism.
Given the technical reset from oversold conditions and multiple fundamental catalysts converging, the most probable path sees MNT consolidating between $1.15-$1.30 before attempting another leg higher. The 16% weekly gain needs digestion, but with RSI barely above neutral and ADX showing early trend development, odds favor continuation over reversal in the coming sessions.