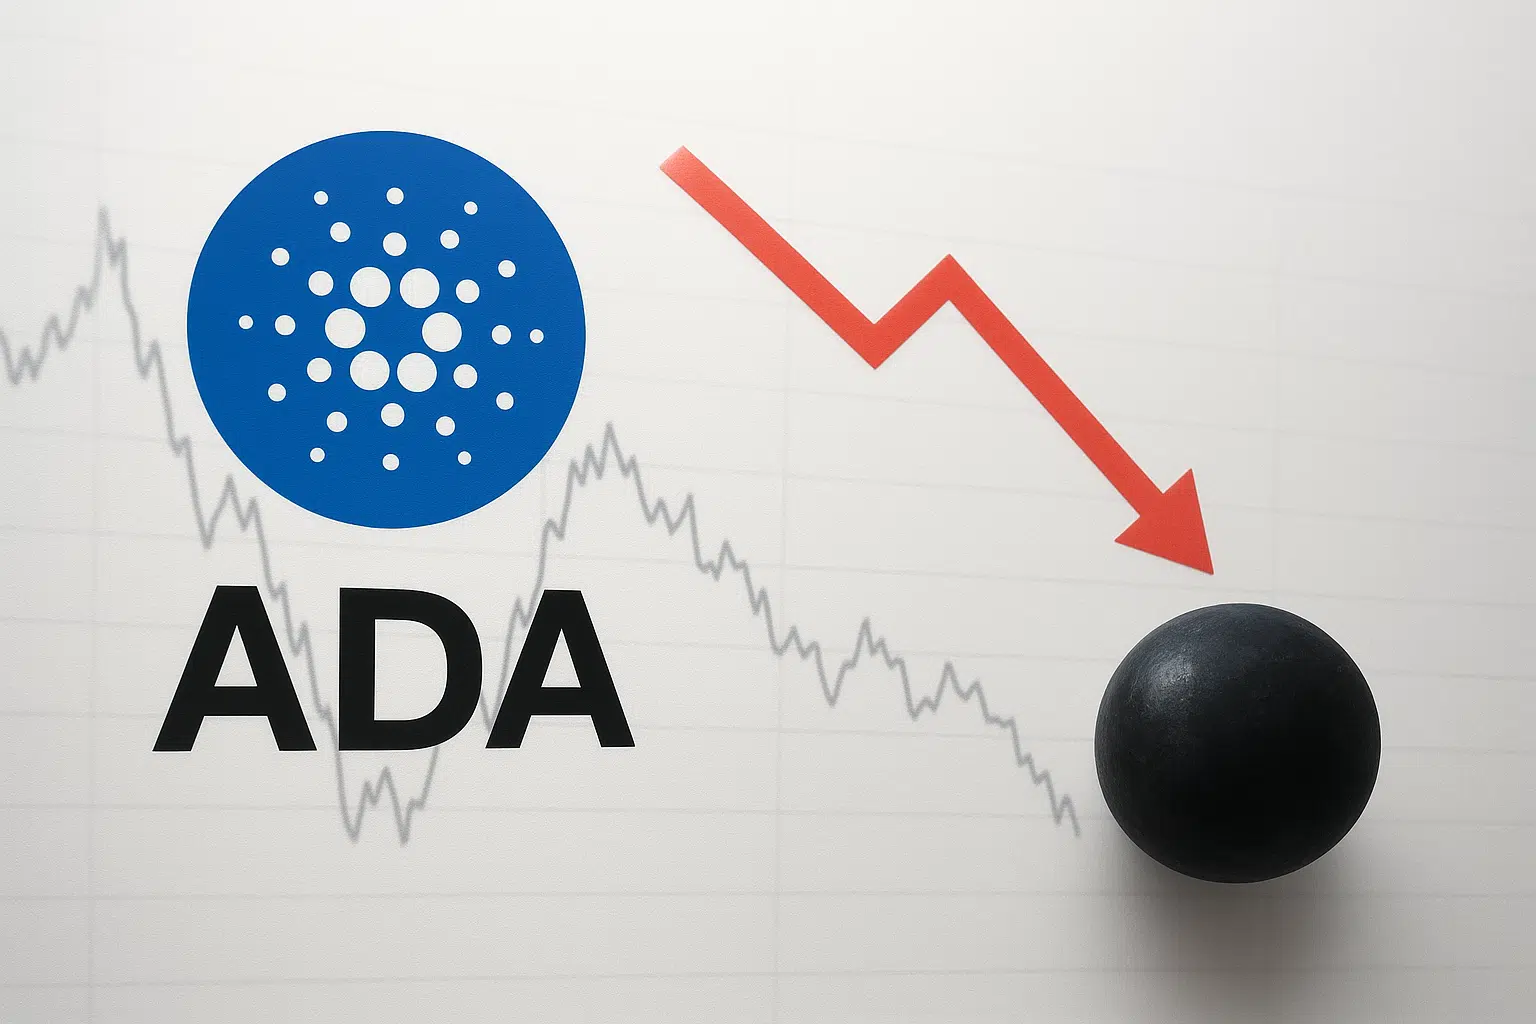
Cardano Tests Critical Support as NIGHT Token Launch Fails to Spark Recovery
Market Structure Shifts Lower
- Cardano (ADA) price failed to hold above the 10-week simple moving average (SMA) and the 50-day SMA this week, the first unsuccessful test since early November 2020.
- Although the decline was sharp, overnight support at $0.371, the 50-day SMA, checked the prevailing downtrend.
- In contrast, the breakdown 2.5 weeks ago occurred at the 26-day SMA without any resistance identified until the 10-week SMA.
The difference this week is that the technical levels are not only well-defined but also offset by the dual 74.1 readings in the daily Relative Strength Index (RSI) and the 6-day and 6-week Relative Strength Indicators (RSI).
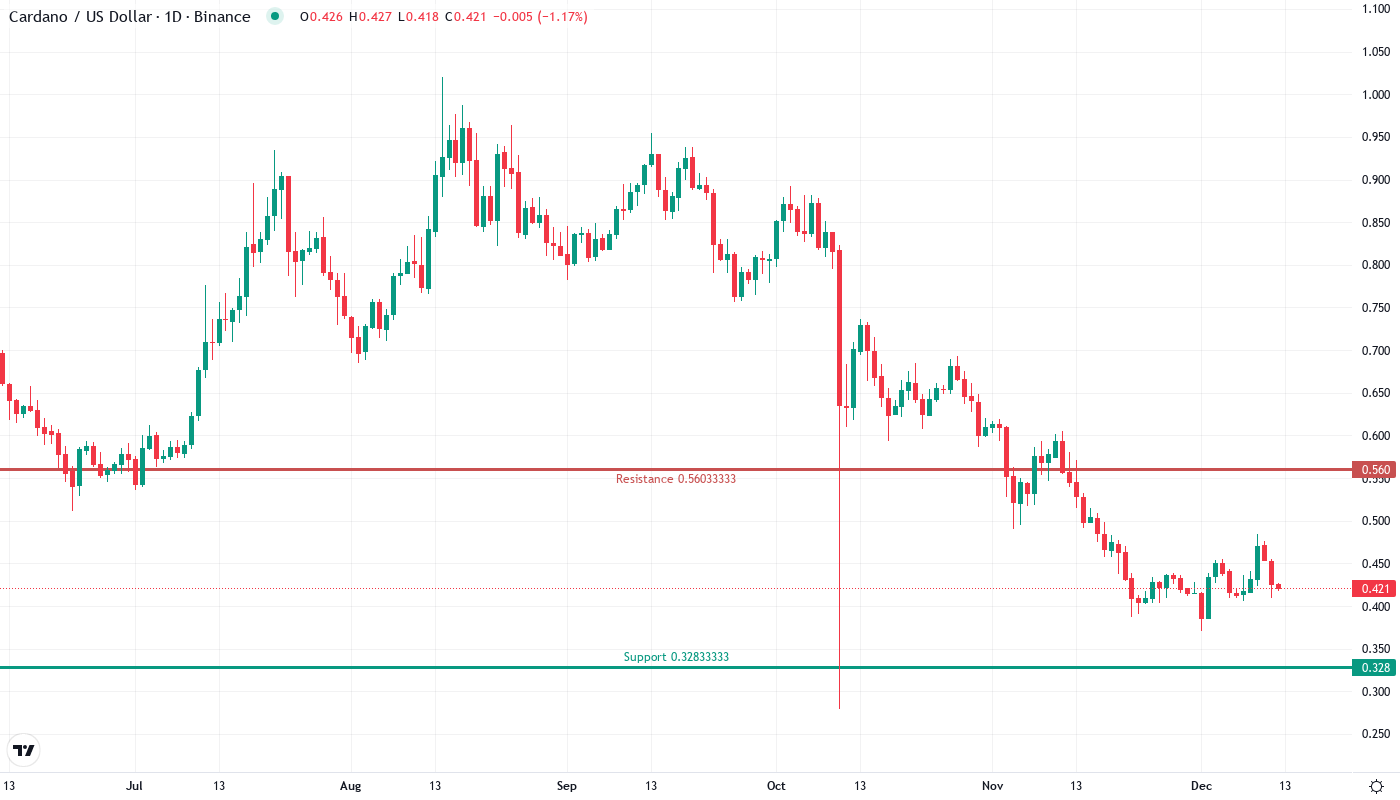
This week selloff sliced through May’s $0.927-midpoint double wick low, reinforcing the broader downtrend’s momentum while the NIGHT token launch also met a market that hasn’t been particularly nuanced, with violent breakouts deciding the direction. CARDANO has dumped to levels not seen since January 2018 after losing the crucial $0.782–$0.81 tower high double wick low support in binary fashion. The push through four key weekly inflection points at $1.389, $1.285, $0.927, and $0.554 suggests the path for the next three-to-six months will be lower.
| Metric | Value |
|---|---|
| Asset | CARDANO (ADA) |
| Current Price | $0.42 |
| Weekly Performance | -4.54% |
| Monthly Performance | -24.42% |
| RSI (Relative Strength Index) | 42.7 |
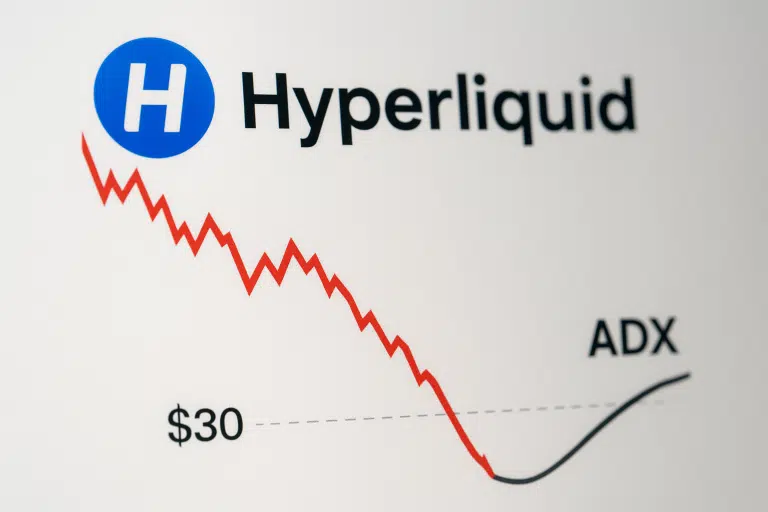
| ADX (Average Directional Index) | 35.3 |
| MACD (MACD Level) | -0.02 |
| CCI (Commodity Channel Index, 20-period) | -24.22 |
RSI Climbs From Oversold Territory After Testing 20-Level Floor
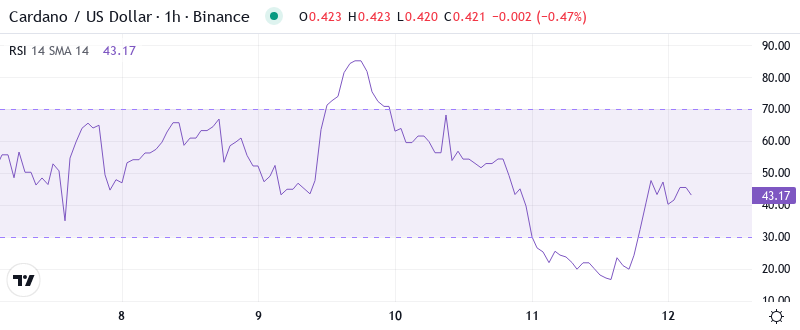
The Relative Strength Index (RSI) sits at 42.71 on the daily timeframe, where it is recovering from deeply oversold conditions that last matched levels seen during August’s capitulation phase. The oscillator’s bounce from the 20-level floor — territory such has historically marked exhaustion points for ADA — suggests that selling pressure may be temporarily spent.
What is interesting to note is the way RSI performed during the NIGHT token launch news. In spite of this good positive development, momentum hardly went over 45, suggesting that most traders are not convinced about the short-term prospects of a recovery. Therefore, for swing traders, this lukewarm RSI reaction suggests they must wait for the rally to cross the key level of 50 before placing any bets on the fact that the upside can be maintained.
ADX at 35.26 Confirms Mature Downtrend Nearing Potential Exhaustion
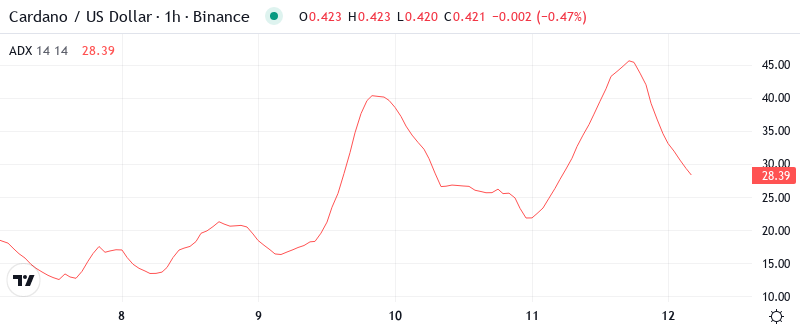
When assessing the strength of a trend the ADX reading of 35.26 suggests that we are in a very strong directional trend that is getting up there in the historical books in terms of some of the more extreme readings we have seen. This means that the downtrend has gained enough steam that all countertrend bounces have stiff resistance in front of them yet at these levels the reading is also beginning to hint at the downtrend exhausting itself.
In simple terms, when Cardano’s ADX crosses above 35, the cryptocurrency tends to experience a strong reversal or enters a consolidation phase before the subsequent significant movement. The 750M token inflow that caused this week’s weakness intensified this cross’s trend transition, and as such, day trading could see higher volatility as the market determines if it wants to reverse out or break downside supports.
Moving Average Structure Remains Heavily Bearish Despite Oversold Bounce
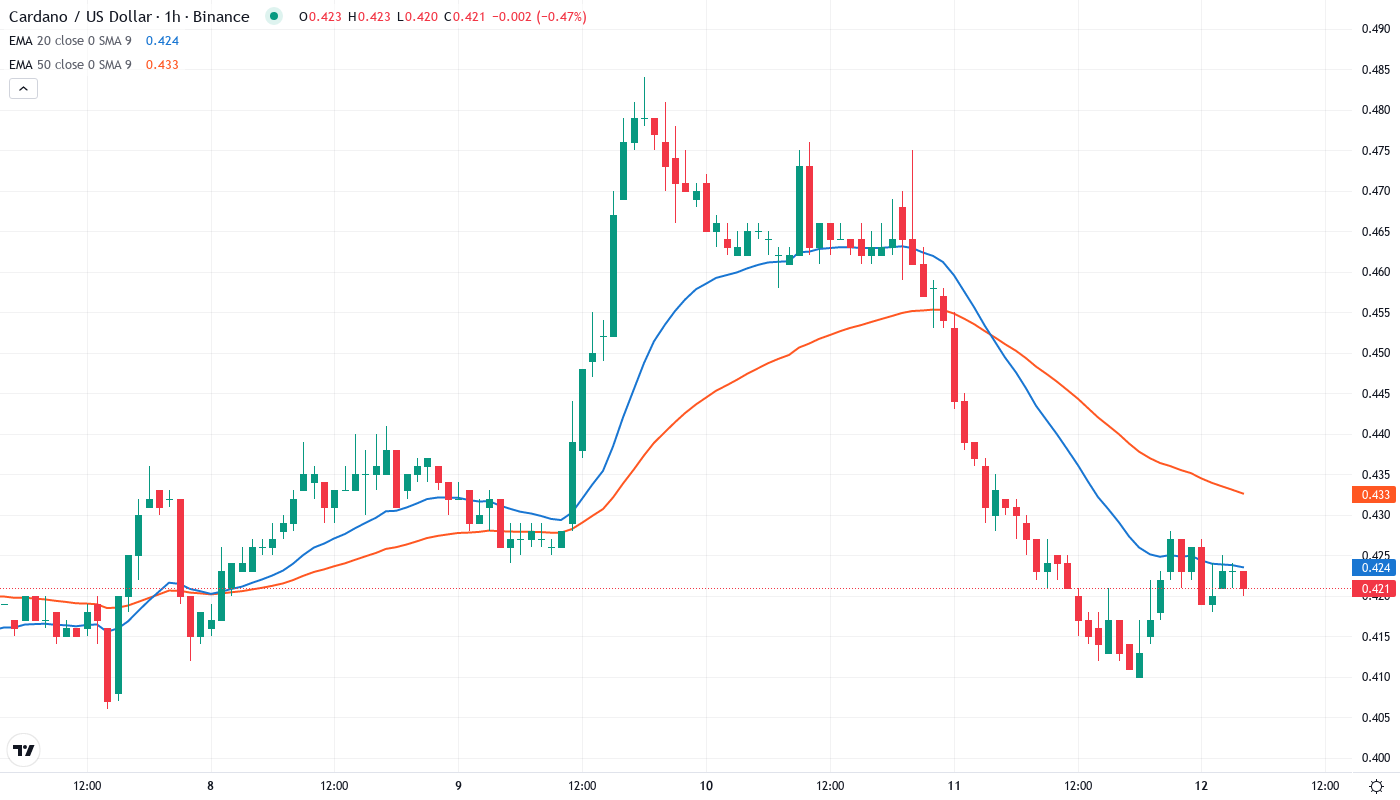
The price action indicates that the ADA bulls are alive and kicking, as attempts to renew the uptrend are keeping the bears at bay. However, the real drag comes from the immense overhead pressure supplied by the EMAs.
For now, the objective has shifted to $0.468 support to at least cap declines to lower levels, with the 23.6% Fib of the current rally extending down at $0.396. Buyers there are a big ask, but would help keep the bull train on track for a challenge of $0.589.
Double Bottom Formation at $0.371 Becomes Make-or-Break Zone
Strong resistance lies between $0.50 and the 50-day EMA at $0.459, with December’s psychological price floor acting as a barrier to any hopeful latecomers. The monthly pivot at $0.474 will create a resistance cluster, and buyers will look to offload NIGHT.pm tokens into rallies towards $0.50.
The support architecture appears to be more solid. The monthly low has been tested twice now without being broken, which is a possible double bottom. This level could be seen as more important as it also corresponds to historical accumulation zones where big player activity has increased in the past cycles.
The market structure is showing a coiled spring between $0.371 support and $0.459 resistance. Given the 37,655% increase in activity and the growing open interest, this coil likely releases substantially one way or the other when the market establishes its direction.
Bulls Need Volume-Backed Reclaim of $0.459 to Shift Momentum
Buyers need to push the price above the 25 pence resistance and the 50-day EMA at 27 pence. What’s more, the 50-day EMA needs to form a bullish cross with the 200-day EMA to confirm the double-bottom pattern. If that happens, the NEXT stock could target the 35 pence level.
If ADA were to drop below the $0.371 support and closes the daily there, the setup would invalidate itself and there would be nothing but air down to the $0.30 level – which is roughly 29% lower than current prices. This would presumably lead to NFT dip buyers getting caught and triggering stop-losses left and right.
Considering the recent recovery from very low levels and the formation of a low price base at an important supporting level, it is most likely that ADA will stabilize in the range of $0.371 and $0.459 as the impact of the 750M token inflow is absorbed, and then check for a new direction.