APT Slides to $1.70 as Momentum Exhausts After 85% Annual Decline
Market Structure Shifts Lower
- APT tests critical $1.70 support after failing to hold above $2.00
- RSI drops to oversold territory at 29.96 – first time since October
- ADX spikes to 49.66 signaling conviction behind the downtrend
Aptos has endured a devastating drop to $1.70, shedding 48.5% over the past month and extending its yearly decline to a crushing 85.35%. The altcoin’s price action tells a stark story of momentum exhaustion, with sellers overwhelming any attempt at recovery despite recent ecosystem developments including Goblin Finance’s $1M funding round for building Aptos’ yield layer. The main question for traders is: can the $1.70 level hold as final support, or will bears push for a complete capitulation below this psychological floor?
| Metric | Value |
|---|---|
| Asset | APTOS (APT) |
| Current Price | $1.70 |
| Weekly Performance | -15.79% |
| Monthly Performance | -48.51% |
| RSI (Relative Strength Index) | 30.0 |
| ADX (Average Directional Index) | 49.7 |
| MACD (MACD Level) | -0.28 |
| CCI (Commodity Channel Index, 20-period) | -100.70 |
RSI at 29.96 Signals First Oversold Reading Since October Bottom
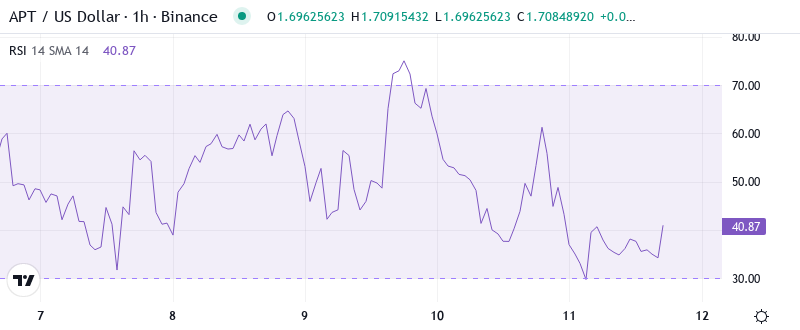
Reading the oscillator at 29.96, traders see classic oversold conditions that typically mark at least a temporary floor. What’s particularly revealing is how rapidly RSI collapsed from neutral territory just two weeks ago – this kind of momentum washout often precedes sharp relief bounces when selling pressure exhausts itself.
Historically, APT has bounced from sub-30 RSI readings three times in the past year, with the most recent occurrence in October preceding a 40% rally within weeks. So for swing traders, this oversold extreme presents a high-risk, high-reward setup where any positive catalyst – like the expanding DeFi yield infrastructure from Goblin Finance – could spark a violent snapback rally.
ADX at 49.66 Confirms Mature Downtrend Nearing Exhaustion Point
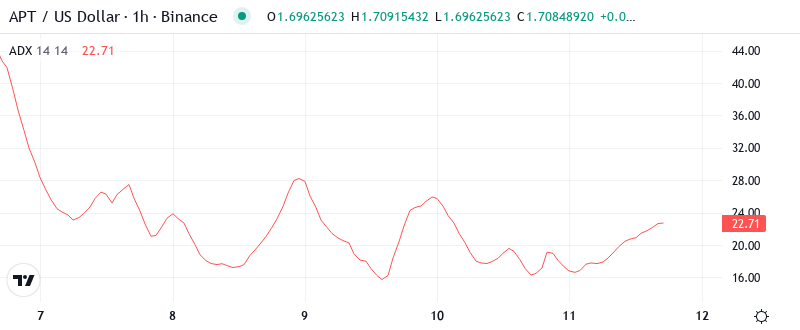
At the level of 49.66, the ADX entry indicates extreme trend strength that’s actually becoming unsustainable. Basically, when ADX climbs this high, it signals that one side of the market has become completely dominant – in this case, the bears have taken full control and pushed out nearly all buyers.
Similar ADX spikes above 45 marked significant turning points for APT in March and August, both times preceding multi-week consolidation periods that reset momentum indicators. Therefore, day traders should prepare for increased volatility as this extreme reading typically leads to either capitulation wicks or sharp reversals when the selling pressure finally subsides.
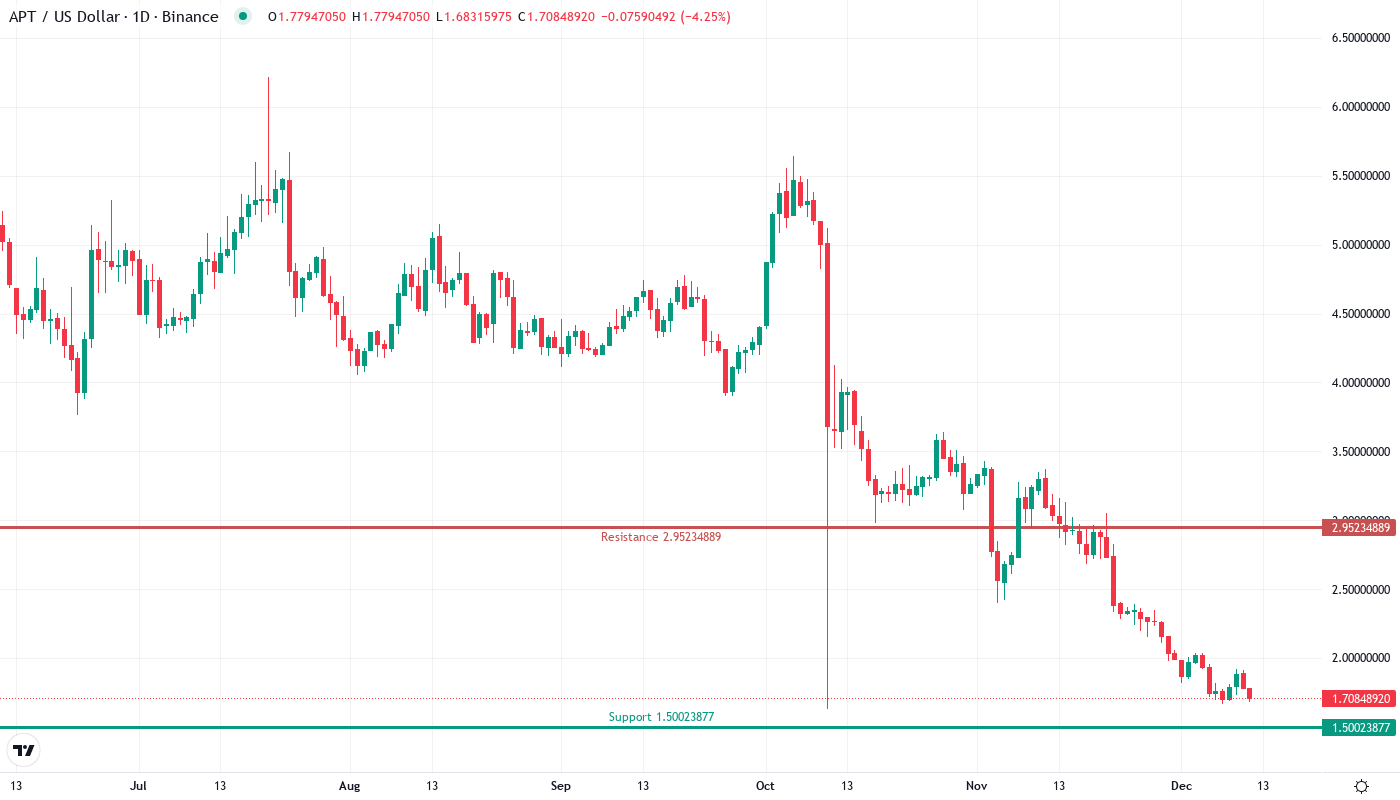
All Major EMAs Stack as Resistance After $2.00 Support Flip
Price action through the EMA ribbons paints a grim picture for bulls. APT trades deeply below every significant moving average – the 10-day ($1.85), 20-day ($2.04), 50-day ($2.58), and the distant 200-day at $3.20. Most critically, the 20-day EMA that provided support throughout early December has now flipped to resistance after price failed to hold above the psychological $2.00 level.
This complete breakdown of the moving average structure typically signals a shift to lower timeframe trading until price can reclaim at least the 20-day EMA. The 50-day EMA at $2.58 now represents a massive 52% move higher from current levels – that former support area transforms into a formidable ceiling that would require significant buying power to overcome, possibly driven by broader Web3 adoption in India where Aptos is gaining traction.
Support Crumbles Below $1.70 While Resistance Stacks Dense Above $2.00
Resistance clusters thick between $1.85 and $2.25, with the 10-day EMA at $1.85 serving as the first barrier for any recovery attempt. Above that, sellers have fortified positions at the psychological $2.00 level where December’s support failed, creating a double layer of supply that coincides with the 20-day EMA at $2.04.
Bulls defend what little remains at the current $1.70 level, which represents the last meaningful support before the yearly low at $1.66. The lack of historical price action below this zone creates an air pocket of uncertainty – if $1.70 fails to hold, there’s minimal technical support until the $1.50 psychological level or potentially lower.
Market structure reveals complete bearish dominance with no signs of accumulation yet. The absence of any higher lows or even a pause in the decline suggests that bottom-fishers remain sidelined despite the oversold conditions and ongoing ecosystem developments. This configuration resembles a market waiting for complete capitulation before any sustainable recovery can begin.
Bears Target $1.50 as Bulls Need Reclaim Above $2.00 for Reversal
Bulls require a decisive daily close above $2.00 to signal any meaningful shift in structure. Such a move would need to be accompanied by a surge in volume and ideally coincide with positive developments from the Goblin Finance yield layer launch or increased adoption metrics from India’s Web3 expansion.
The bearish scenario accelerates if APT loses the $1.70 support on volume – this would trigger stops from recent bottom-fishing attempts and likely cascade toward the $1.50 round number or even retest the $1.30 zone last seen in 2023. Given the mature downtrend and lack of buying interest, this remains the higher probability outcome.
With current momentum firmly bearish and no technical signs of reversal despite oversold readings, the most probable near-term path sees APT grinding between $1.65-$1.85 while momentum indicators reset from extremes. Any sustainable recovery requires reclaiming the $2.00 level first – until then, the path of least resistance remains lower.