HYPE Plunges to $27.49 as Rounding Top Formation Triggers Mass Liquidations
Данные:
- Market Structure Crumbles
- RSI Plummets to 33.62 – Deepest Oversold Territory Since Launch
- Weak ADX at 25.70 Signals Choppy Decline Rather Than Impulsive Crash
Market Structure Crumbles
Hyperliquid has lost almost a third of its value this month, currently trading over 34% lower than the April monthly open after the market lost its bids following the rollover this week. The exchange had been raging with SX deals since launch, and the volume of perpetual swaps was seemingly driving the spot rally parabolically until volume exhaustion was reached.
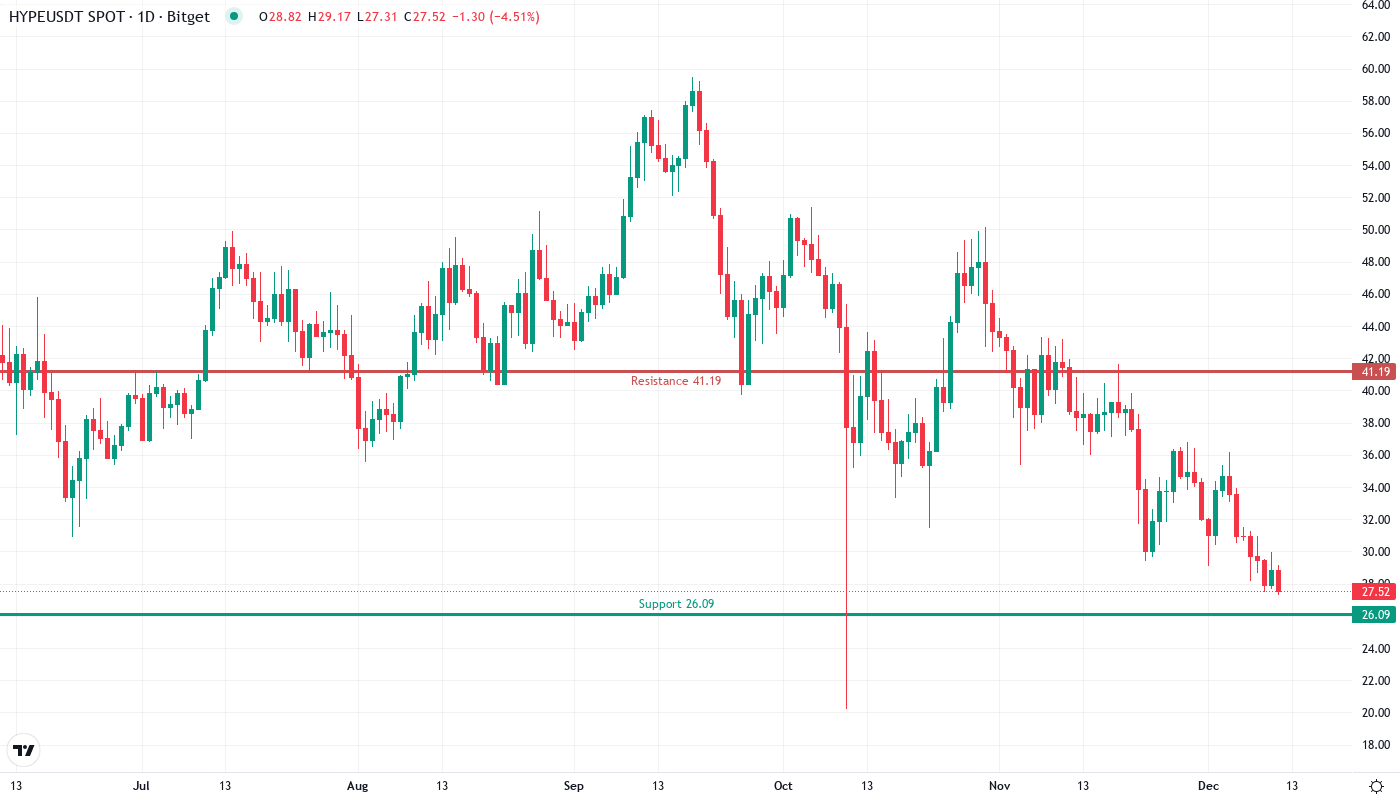
The recent drop of Hyperliquid from $41.63 to $27.49 was a crushing 34% monthly drop, with the coin deleting more than half of recent high values. The rounding top formation that technical analysts have now highlighted is complete, causing a loss of stop loss and idealistic cascades as the volume of derivatives dropped and dominant long liquidation has been a perfect storm for sellers. The floor has HYPE reached the current level, or will $20 psychological support further break the decline?
| Metric | Value |
|---|---|
| Asset | HYPERLIQUID (HYPE) |
| Current Price | $27.49 |
| Weekly Performance | -20.76% |
| Monthly Performance | -33.66% |
| RSI (Relative Strength Index) | 33.6 |
| ADX (Average Directional Index) | 25.7 |
| MACD (MACD Level) | -2.46 |
| CCI (Commodity Channel Index, 20-period) | -135.62 |
RSI Plummets to 33.62 – Deepest Oversold Territory Since Launch
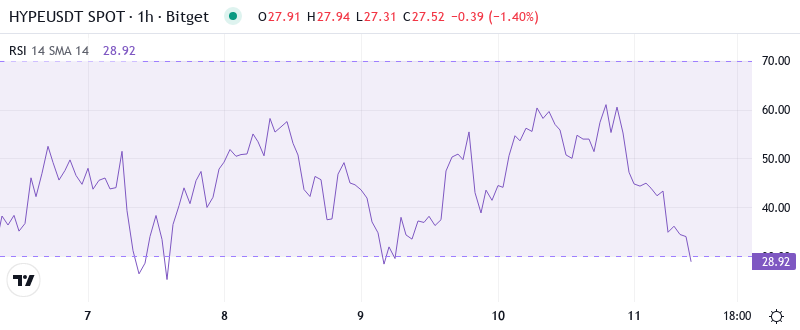
The Relative Strength Index is at 33.62 on the daily timeframe, the most extreme oversold reading in HYPE’s short trading history. This momentum at a capitulation-level matches washout conditions from the textbooks where panic selling is the order of the day and leveraged longs are systematically flushed. Relief bounces of 15-20% were seen in other tokens in December’s broader market correction from similar RSI configurations – but those didn’t have the structure breakdown of a complete rounding top.
What is most interesting about RSI is how it acted on the decline. It only popped slightly above oversold levels during those couple of the biggest down days of the year and has displayed very little power behind any of the bounces since. This is typically a very positive sign for swing traders looking for a lower-risk entry to play a countertrend rally, as extremely oversold RSI levels accompany the most powerful bounces. This is because as fewer traders and investors are left to sell, any buying quickly drives prices higher. Potential bounce targets depend on the medium and long-term outlook. At the low close last week, the S&P 500 was holding support of its 200-week MA. It doesn’t look like it will take more than a week or so before the index tests the 200-week MA. But keep in mind that the 200-week MA was hovering just above the 2016 high. As you can imagine, there was massive accumulation in the S&P near that level. It’s also why we saw the bounce we did.
Weak ADX at 25.70 Signals Choppy Decline Rather Than Impulsive Crash
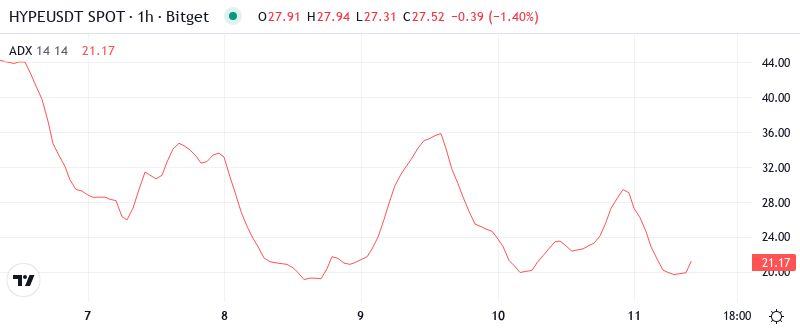
With the ADX at 25.70, the entry is sellers are clearly in charge, but not with the kind of extreme oomph that generally accompanies a capitulation. In other words, the ADX in this case represents a grinding decline as opposed to a waterfall collapse. This moderately low ADX reading actually provides an intriguing contradiction — price is down 34%, but trend strength is still below what we would consider panic levels.
To put it simply, the ADX serves to show that a downward trend is still in place, but it’s not the rapid, down-cliff type of movement that is associated with reaching a bottom. This means that day traders will likely face more volatility, rather than a straightforward push in one direction, as the fact that the ADX hasn’t reached extreme levels indicates that bulls and bears are still fighting over the reigns at these cheap levels. The derivatives-related panic that fueled this drop looks to be subsiding, with the ADX confirming that the selling force is not as strong.
Every Single EMA Rejects Price as Moving Average Cloud Turns Red
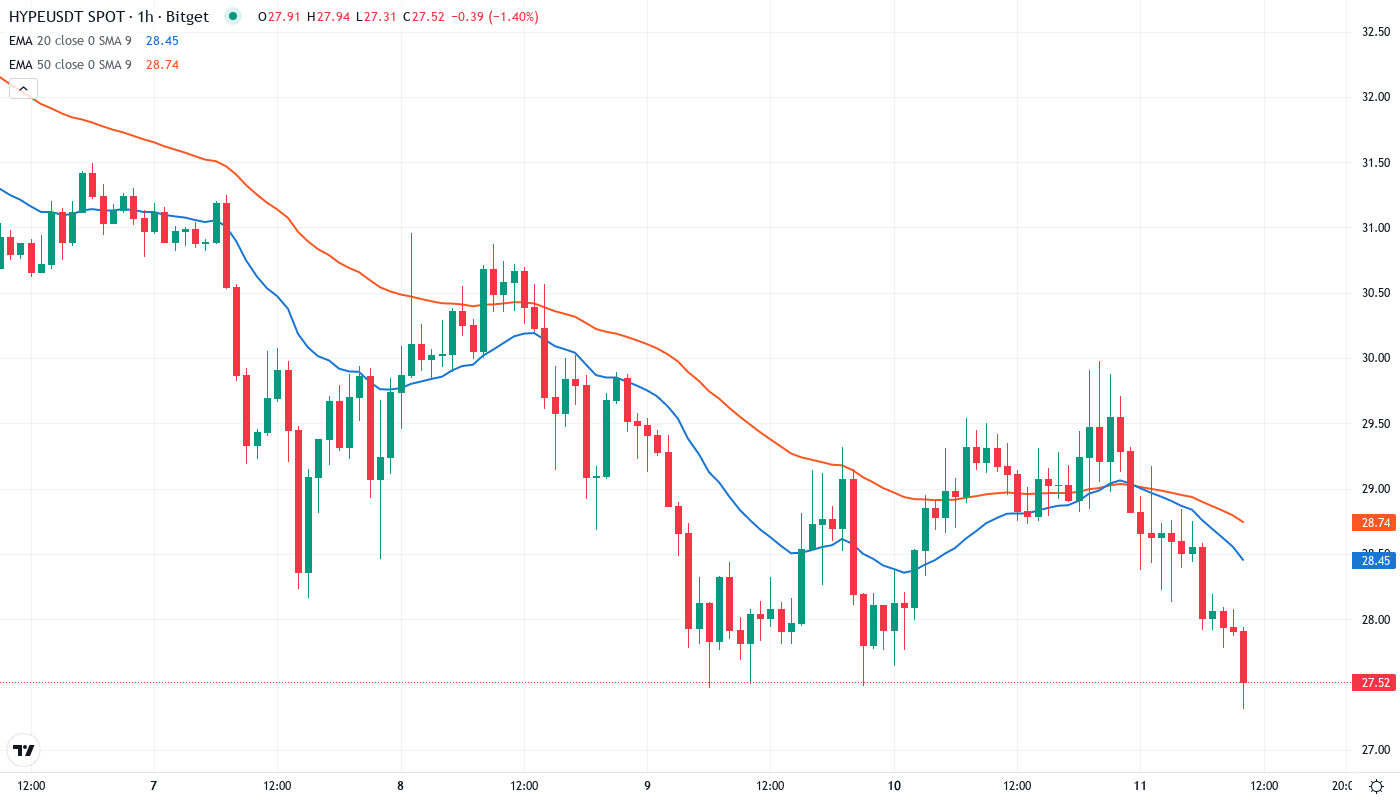
Looking back, the 50-day exponential moving average $32.06 lost as support was the straw that broke the camel’s back. The previous long-term moving average support that was retested two weeks ago failed miserably, as HYPE was subject to three consecutive days of panic selling and endless supply. We were caught emptying inventory, assuming the 50-day EMA would hold up the wall – disregard any long-term protection would send the course tumbling.
When zooming out, the death cross of the fast and slow EMAs solidifies the fact that the midterm trend has turned bearish. The previous support zone around $32-36 is now turning into a huge resistance area that bulls would have to overcome before any trend reversal talks can even begin. The fast EMA breakdown, amplified by the finalization of the rounding top and the liquidation of derivatives, indicates that institutions are unloading their bags at a fast pace.
Support Evaporates Below $27 While Resistance Stacks Up to $39
The immediate support continues to be severely tested after HYPE’s violent disintegration. Bulls are clinging precariously onto the $26.09 monthly S1 pivot, the final technical level standing before a probable collapse towards the pivotal $20 psychological zone. Repeated tests have been made over the course of the last 48 hours at this dire level, with each subsequent relief rally becoming weaker. This is glowingly symptomatic of support exhaustion, which can lead to a terminal breakdown.
There are multiple resistance levels above the present rates, beginning at $35.29, the monthly pivot, through $39.11, the weekly R1, to the breakout level of $41.19. All are joint low long positions from the derivatives demolition, with a significant amount of long pressure on dibs. The monthly R1 at $41.19 is generated, as it is both the neck rounding top and the greatest interchange level ahead of the spill.
Bottom-fishers beware, this market structure screams caution. The risk-reward is heavily asymmetric and clearly favors sellers. It would take nearly an 18% drop to $22.80 to reach a major support zone while a roughly 50% rally is needed to even test the first significant resistance.
Technical Breakdown Complete – $20 Target Looms Without Quick Reversal
For the bulls, all is not lost if the daily higher low pattern remains intact. Look for a potential entry in the low $20s. For the bears, the recent high volume spike should offer little bulls to work with on the way down. The last clear support is $20 and then a lack of support until $4.
If HYPE holds the critical level of around $26.09, it is reasonable to assume the bullish trend can resume. Breaking through the $33.63 swing high should lead to a retest of the $40 resistance area. This level could present the last significant hurdle before a potential all-time high test.
Considering the rounding top has now completely played out and there is potential for an oversold bounce, plus perpetuals funding rates are back to normal, a near-term relief rally is likely to be launched toward $30-32 prior to an inevitable continuation of the downtrend. For long-term investors, let’s see how the retest of the lows goes or look for a reclaim of $35 to be convinced – catching that knife still hurts.