HYPE Tests Critical Support as Rounding Top Pattern Threatens Further Decline
Market Structure Shifts Lower
- HYPE dropped by 17.8% this week, down 31% since December highs.
- Rounding top formation indicates buying momentum is running out of steam.
- Technical signals align: RSI at 35.59 and ADX above 25.
HYPE dropped by 17.8% this week, which has been characterized by a steep decline over the past month, resulting in a 31% loss since the highs of December. The rounding top formation suggests that the buying momentum is running out of steam. The make-or-break support is close to the price. The technical signals are aligned. The RSI currently stands at 35.59, while the ADX has risen above 25.
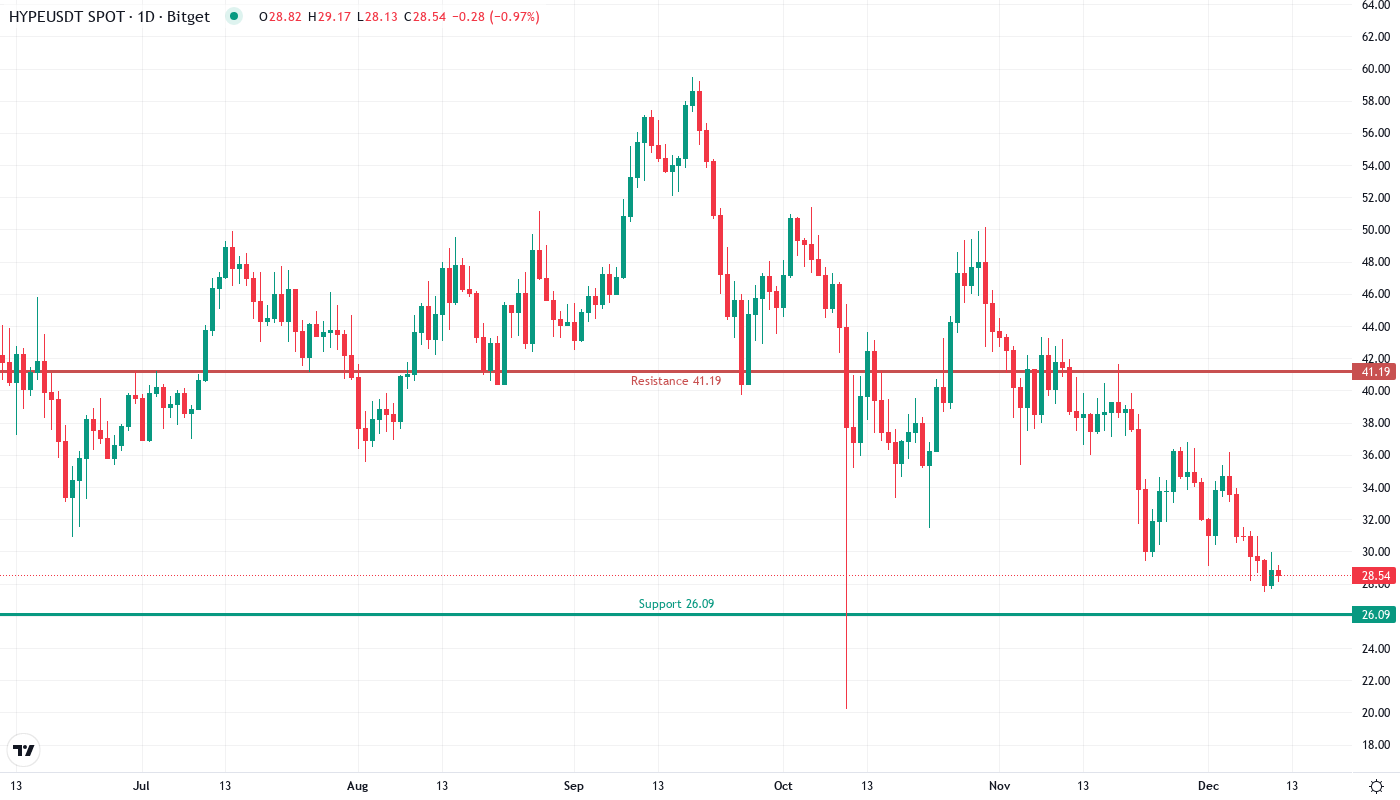
Hyperliquid’s native token HYPE continued its downtrend from December, losing a further 17.8% this week to close out the month down 31.2%. The token is now fetching $28.52, having topped out at $41.63 at the end of December, with the daily chart looking like a classic rounding top pattern, which usually indicates a loss of bullish steam and increased downside prospects. The main question for traders is whether the $25 level can hold on a psychological basis or we get an even deeper set back against $20.
| Metric | Value |
|---|---|
| Asset | HYPERLIQUID (HYPE) |
| Current Price | $28.52 |
| Weekly Performance | -17.79% |
| Monthly Performance | -31.18% |
| RSI (Relative Strength Index) | 35.6 |
| ADX (Average Directional Index) | 25.6 |
| MACD (MACD Level) | -2.38 |
| CCI (Commodity Channel Index, 20-period) | -118.11 |
RSI Drops to 35.59 – First Oversold Signal Since Token Launch
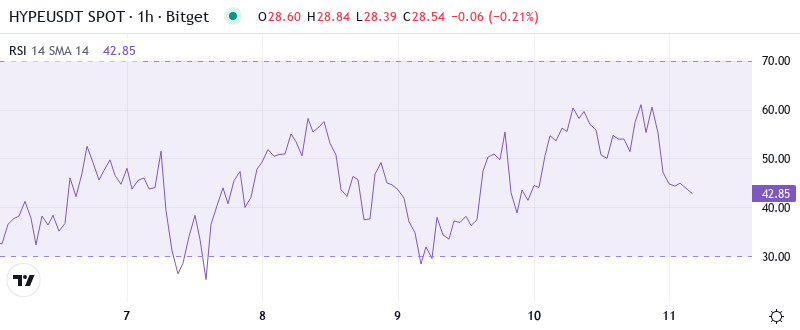
The oscillator also highlights the pertinence of the recent local low at 0.28 as a technical pivot. This level not only loosely aligns with the rally’s 78.6% Fibonacci retracement, it also encompasses previous support now expected to act as resistance (SAAR). This becomes the level to break for a confirmed trend reversal and minimum V-backed recovery rally, events which are likely to coincide. As a 78.6% retracement is typically a key-critical resistance zone, a breach would RAISE THE ODDS SUBSTANTIALLY for a move back up to the trader ma.
What is interesting is the way RSI acted as the rounding top pattern was being shaped which the experts are now alerting to. The oscillator indicated obvious bearish divergence as the price tested new peaks in late December as the momentum measurements were not also testing new peaks, which indicated a breakdown was likely before it happened. This gives a warning to the swing traders that this oversold bouncer comes with a warning-overhead any bouncer will cap the bouncer.
ADX at 25.61 Confirms Trend Shift From Consolidation to Directional Movement
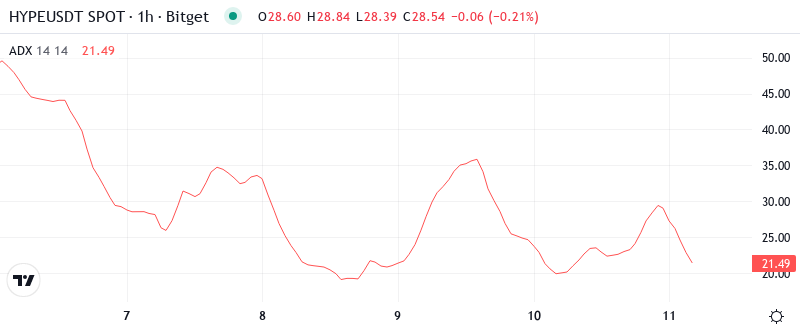
With the ADX now at 25.61, we can expect this dynamic to continue. ADX readings above 25 suggest a trending environment and the higher the reading, the stronger this trend. Reaching 25 already indicates a solid downtrend, one that is only likely to accelerate as we proceed through the trading week.
After weeks of sideways movement, trend followers finally have something to work with. The ADX reading implies the downtrend can continue as it quickly ramped from sub-20 readings last week. In simplistic terms, the rapidly established trend following a super low the prior week can gain new legs. While the oversold RSI suggests a bounce could be had, the rising ADX would issue caution as they’d likely be of the weak, counter-trend variety in the absence of previous price destruction.
20-Day EMA at $32.16 Becomes First Major Resistance After Support Failure
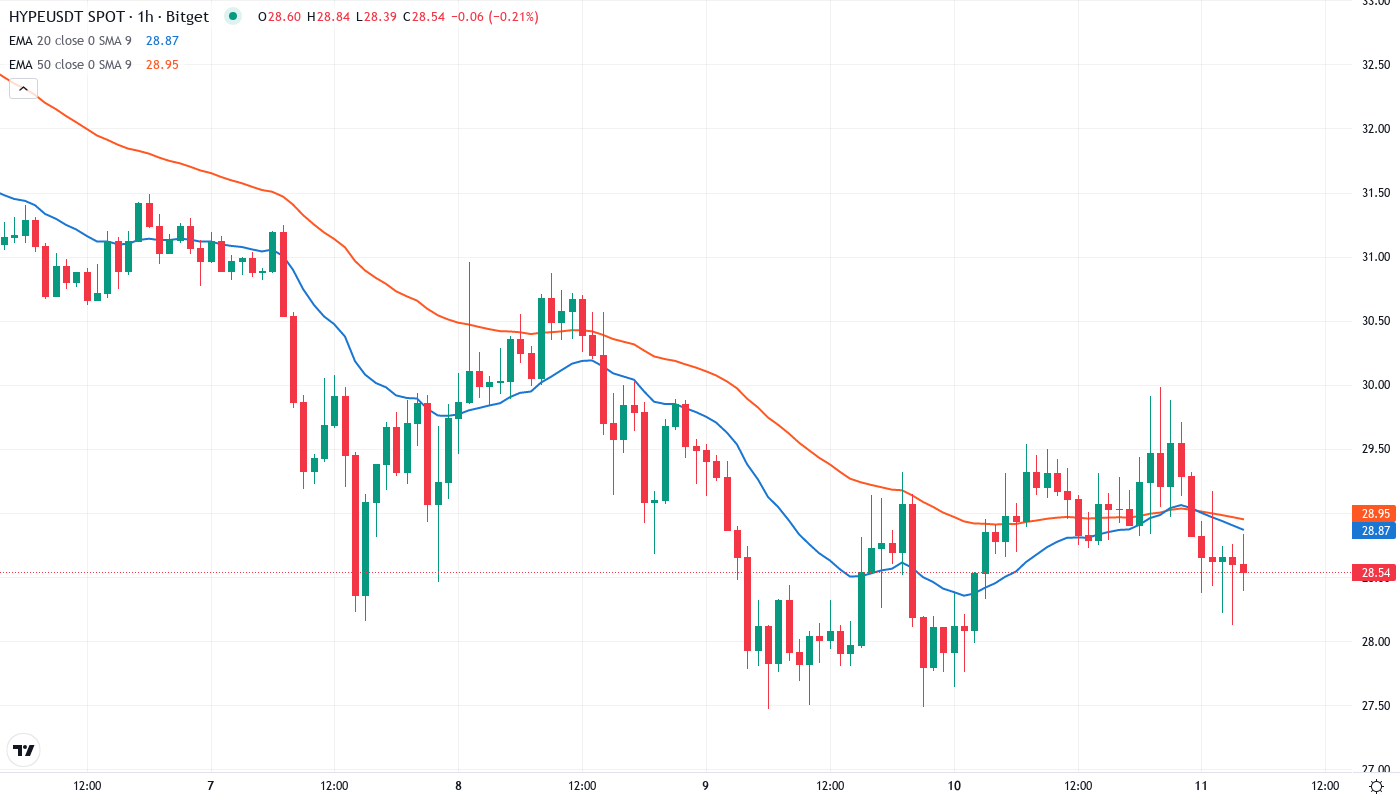
The EMA ribbons price action indicates a strong reality of structure decay. HYPE is currently trading significantly beneath its complete moving average ribbon. The 10-day EMA is at $30.31, the 20-day at $32.16, with the 50-day firmly establishing itself at $35.94. The most important moving average, the 20-day EMA that supported the price during the rally of December, has now turned the price down and has rejected the 2nd rebound with HYPE rounded summit.
When we consider the moving average configuration below, it is likely that bulls will get trapped between the 10- ($30.46) and 20-day EMAs ($32.84) should they attempt a rally; $35.98 is the centerline level for the 50-day EMA. As the chart shows, the stock is unlikely to reclaim the important former support zone: the 50 percent Fib retracement of the entire 12-month rally and the August secondary offering at $32.16.
Resistance Stacks Heavy Between $32 and $36 as Rounding Top Looms
There are several levels of resistance that make it hard for the price to go up. First, there’s the psychological barrier of $30, where the 10-day EMA (Exponential Moving Average) and the rounded number itself create resistance. Then, at $32.16, the 20-day EMA coincides with the neckline of the rounding top formation, marking a stronger resistance zone. After that, there is a 26% gap between the price and the 50-day EMA at $35.94, which is the amount the price needs to increase to reverse the bearish trend.
Bulls are trying hard to protect the $28 support level after three tests this week. However, the fact that the price keeps dropping to this level hints that it is getting weaker with each retest. A stronger support area is found at $25.66, which corresponds to the consolidation floor of the cryptocurrency from early December. If breached, the price of UNI could easily fall to the psychological $20 level since there is no historical support to rely on. This would be worrying given the overhead bearish pattern.
The market structure is telling when a rounding top pattern takes full form. With this coupled with failed 20-day EMA reclaims and increased separation from key moving averages, it’s likely that distribution unfurling is more probable than not. And when you couple in the fact that each subsequent rebound attempt takes place on lighter volume while declines occur on heavier volume (the greatest force behind any move), it becomes clear that the bigger money is utilizing these bounces to lessen exposure.
Bears Target $25 Support as Rounding Top Pattern Completes
Bulls need a decisive daily close above $32.16 to negate the immediate bearish stance and confirm that the oversold bounce may further develop. A break above the 20-day EMA and the rounding top’s neckline could lead to short covering as the price is likely to rally close to the $36 level. However, considering that we are at the pattern’s target and the overall structure is bearish, any new longs should probably be reevaluated unless there’s a notable spike in buying interest.
If support at $24 after that fails to hold, we could see a cascading “flush” day that may momentarily breach $20. Strong foil buys could result in a potential bearish retest move. If instead the price moves straight south from the flush, then $18 is the pancake target for the bearish beauty. A bounce from that level is likely—probably a play. But if $18 is lost, the $14 ticket is next.
Based on the technical setup and confirmed bearish pattern, the most likely short-term scenario sees HYPE making an oversold relief rally towards the $30-31 area before the downtrend restarts and the $25 level is tested. The very oversold condition and the proximity of resistance make short positions an attractive proposition on any rally, while long-side players should be patient and wait for subsequent evidence of technical failure before considering any counter-trend bullish plays on a technically compromised pattern.