Chainlink Tests Critical Support as Mastercard Integration Sparks Recovery Hopes

Market Structure Shifts Higher
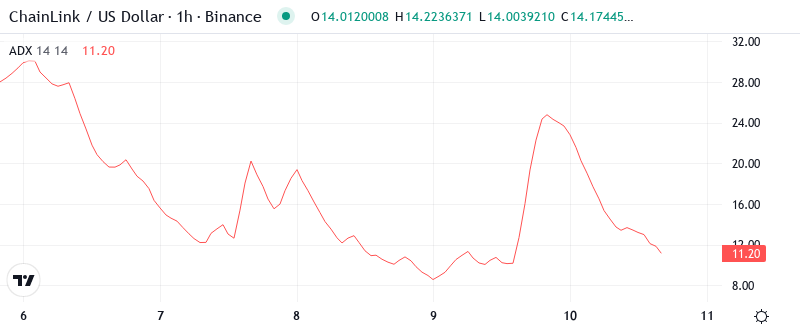
- Token bounced 4.8% after touching six-month low
- Bounce off $11.60 level and Mastercard link adds 3.5 billion users
- Technical chart indicates oversold recovery with resistance above $16
The Chainlink token has bounced by a solid 4.8% this week after touching the lowest level in six months. This rebound comes after the price bounced off the $11.60 level and linked with Mastercard which adds 3.5 billion users to the Chainlink platform. The technical chart for Chainlink seems to indicate oversold recovery, although the resistance for the token is above the $16 mark.
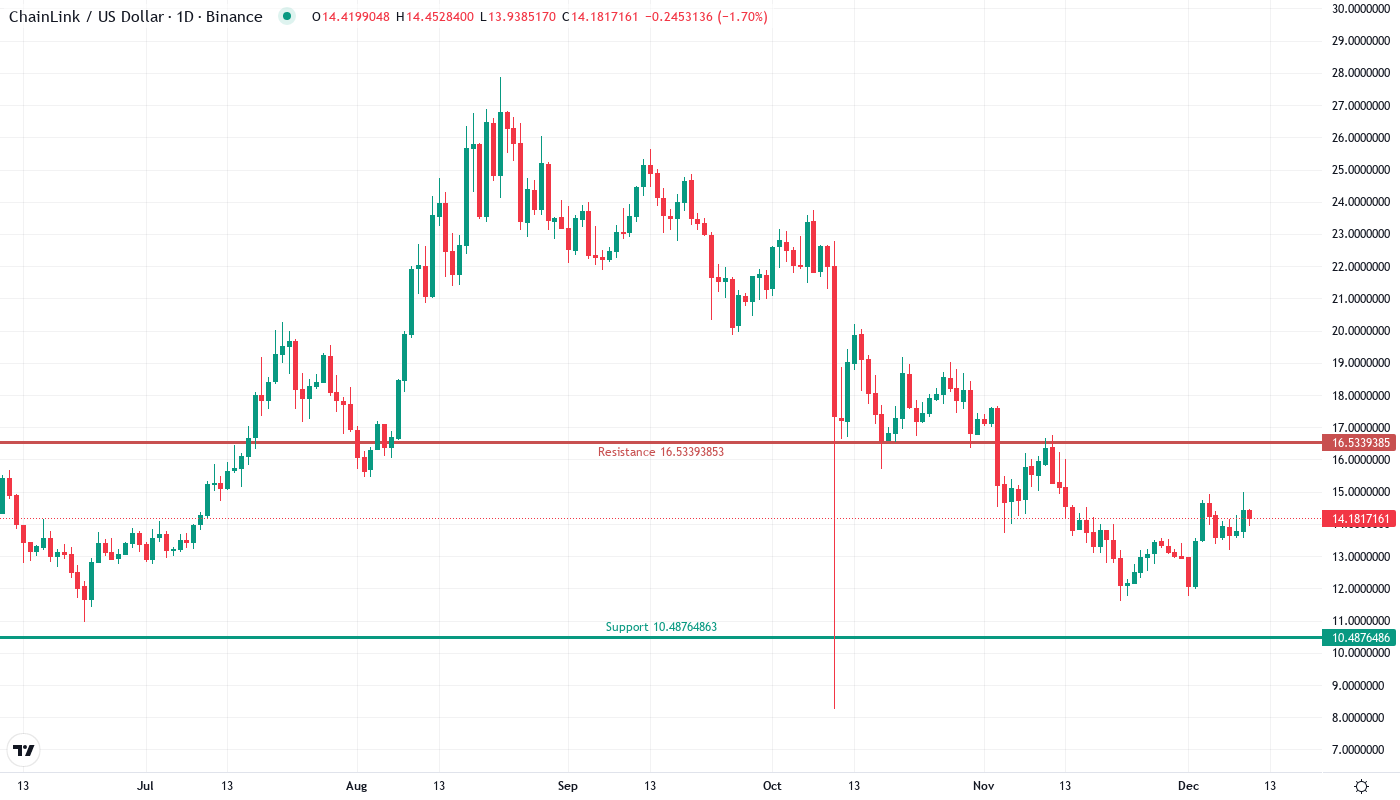
The price action suggests Chainlink is in a tug-of-war between these opposing forces. Fears that the September 2021 peak at $36.93 marked a long-term cycle top have built since January’s failed attempt to recapture that level. Greater macro headwinds throughout October – a seasonal downturn in crypto performance coupled with macroeconomic uncertainties – exacerbated the situation as LINK tested the $11.60-12.50 monthly market structure level. Chainlink held it, but prices have yet to print new monthly highs. Buyer expectations are lower for lower highs and lows, opening up the possibility of testing monthly equilibrium below. Price resistance cluster at $15.00 is a logical level that served as May 2021 support at $15.40. Buyers need to see a monthly close above this level to be constructive on higher highs.
| Metric | Value |
|---|---|
| Asset | CHAINLINK (LINK) |
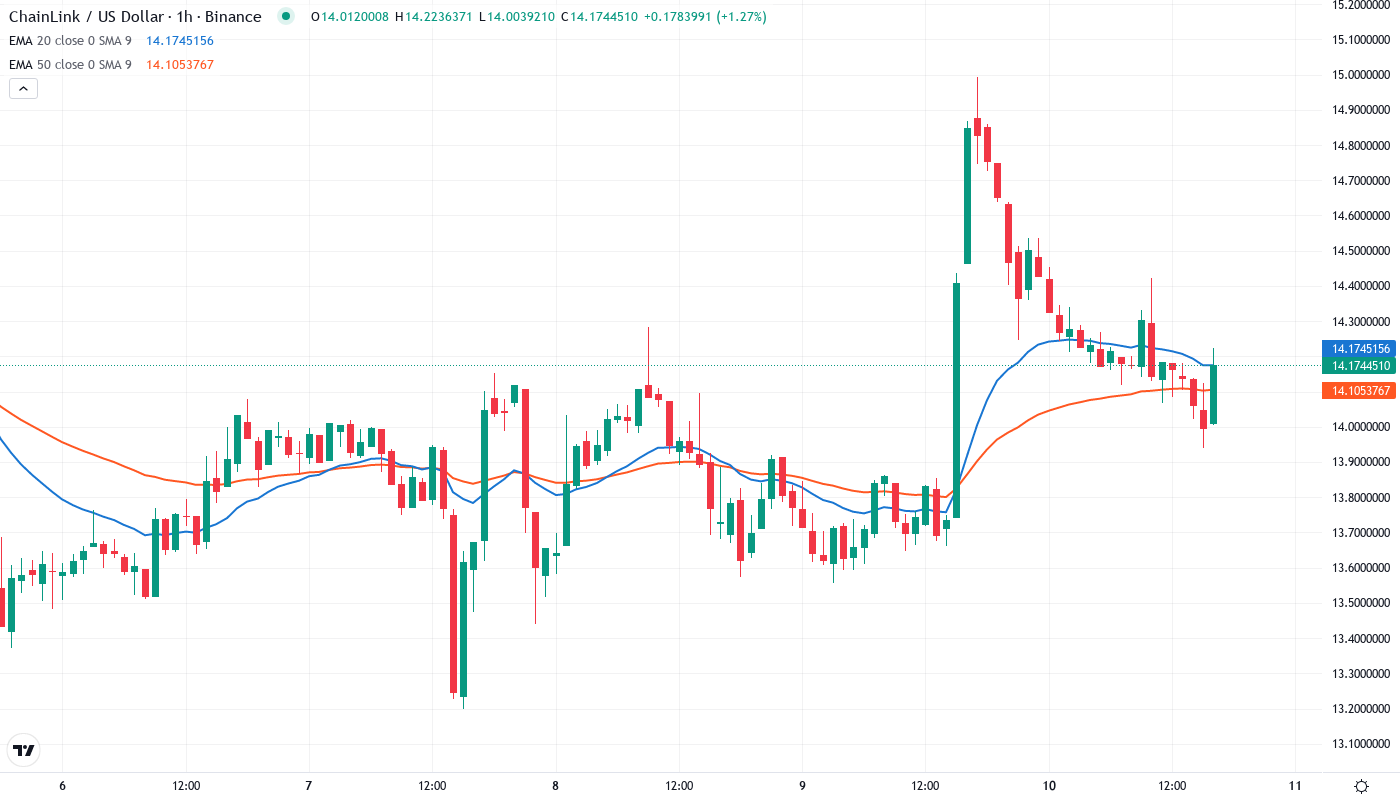
| Current Price | $14.14 |
| Weekly Performance | 4.80% |
| Monthly Performance | -10.94% |
| RSI (Relative Strength Index) | 51.2 |
| ADX (Average Directional Index) | 25.6 |
| MACD (MACD Level) | -0.16 |
| CCI (Commodity Channel Index, 20-period) | 97.60 |
Oversold RSI Bounces From 30 Floor – Matches Previous Recovery Zones
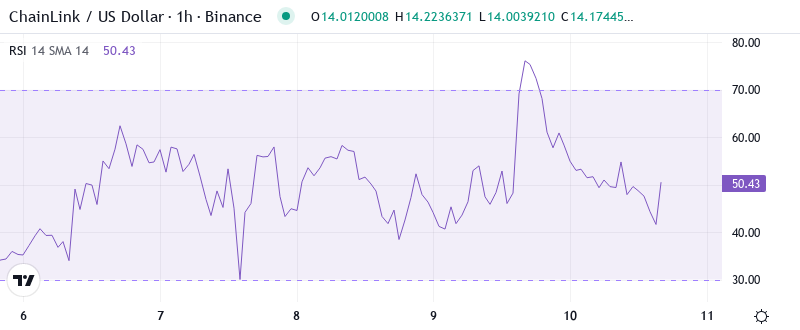
The relative strength index (RSI) remains subdued at 51.17 on the daily timeframe, perking up from oversold regions last week after bottoming near 30.00. It is a typical oversold bounce scenario with the momentum tools highlighting the fact that the buyers have entered on readings of extreme bearishness. The RSI levels below 35.00 have propped up broad-based recovery momentum in the past. For instance, a similar RSI dip seen in early August last month had set off a 45% rally in the subsequent four weeks.
For swing traders who are looking for mean reversion opportunities, the prevailing RSI levels present a pretty low-risk high reward perspective. The oscillator could push higher into overbought territory above 70, particularly if the Mastercard announcement brings in more new money. However, the weekly RSI is currently at 42.02 which indicates that the longer term is far from washed out.
ADX at 25.58 Confirms Trend Acceleration From Recent Lows
When it comes to directional movement, ADX clocks in at 25.58 as an increase from the low teens in December’s choppy consolidation. Crossing above the 25 threshold indicates that participants in the market are pushing for direction as opposed to ranging. We are moving from a time when bulls or bears had little grip on price action to a time when trending conditions take over.
Based on historical performance, a higher ADX reading results in a greater likelihood of a positive trade in the direction of the trend. The longer prices move in a straight line, the more dramatic the subsequent correction when trend followers reach exhaustion. Buy-side order flow is amplified in trend environments, leading to abnormal momentum and acceleration.
20-Day EMA at $15.52 Becomes First Major Resistance Test
Looking to the downside, the setup in January closely resembles our last analysis. However, with the exception that price history at these levels will be weaker support, due to the lack of immediate resistance during last month’s plunge. Nonetheless, the $10.70 to $11 area remains the final stand before a plunge into the high single digits. Most notably, this area provided the level at which buyers finally stepped in at the end of the September/early October downtrend.
Buyers will target a close above the 100 EMA to attempt a turnaround of the bearish development. You have a couple of resistance stages near the 100 EMA, with the November pivot R2 at $16.64 and the 100 EMA at $16.77. We’d like something more substantive than a candlestick if you decide to test those two levels. If the upward momentum rises, the next hurdle is the monthly pivot R3 quartered at $17.76.
Resistance Clusters Between $16.05 and $16.75 Cap Near-Term Upside
Sellers have the upper hand above the current levels as well as the resistance offered by the 50-day EMA and the psychological level of $1,500. The zone around the 50-day EMA is also likely to act as a stiff resistance. If the price turns down from current levels, the first support is at the 20-week EMA. This is an important support to watch out for, because if this support cracks, the decline can extend to the 50-week SMA.
The strong rebound from the support zone near $38 suggests energy bulls remain in control, with the latest push taking the sector to a four-month high. The $48 level that held gains in February 2023 is within striking distance, raising the odds for a breakout that could generate substantial upside into the mid-$50s. A pullback that holds the broken .786 retracement near $42 would also be constructive, reinstating new support ahead of continued gains.
The market structure is an intriguing one in the sense that every support test has brought in stronger demand. The six-month low at $11.60 registered 18 percent above the 10-day average volume, indication some sort of institutional accumulation at significant cheaper priced levels. As long as the $13.30 pivot is defended on any pullback, the bias is to fill the gap to resistance at $16.00.
Bulls Require Decisive Close Above $15.52 to Confirm Trend Reversal
If LINK is able to overcome the $17.50 resistance, it can extend the up-move to $18.96 and above it to $20. The upsloping moving averages and the RSI in the overbought zone indicate that the path of least resistance is to the upside. This bullish view will be invalidated if the price turns down and plummets below the 20-day EMA.
If the price rejects $15.00 and falls below $13.30, the bears are back in control. In this case, the recent buyers will be trapped, and the price will be pushed to $11.60. A low volume on the breakout below that level will indicate a lack of demand, which could send the price even lower to $10.50.
Based on the measured target of $17.70 post-breakout, the application of a $2.40 range defends a short-term bullish outlook while the nascence of the move creates the possibility for quick retracements. Varying on the risk tolerance of the trader, a close below $12.80 resulting in lower volume could overturn the breakout and lead to a retest of the $11.50 level.