HYPE Surpasses $29 as Buyback Program and USDC Integration Spark Recovery

Market Structure Shifts Higher
- HYPE climbs 19% from December lows after $30M buyback announcement
- USDC cross-chain integration enhances platform utility and liquidity flows
- Technical indicators reset from oversold extremes, opening path to $35
Hyperliquid’s native token HYPE trades at $29.06, marking a sharp reversal from the devastating 45% monthly decline that saw price crater to $27.47. The recovery gained momentum after the protocol launched a $30 million treasury buyback program while simultaneously rolling out USDC cross-chain capabilities and leveraged stablecoin trading – developments that reignited institutional interest in the platform. The main question for traders is: can this technical bounce transform into a sustained recovery above the psychological $30 level, or will sellers emerge to defend overhead resistance?
| Metric | Value |
|---|---|
| Asset | HYPERLIQUID (HYPE) |
| Current Price | $29.06 |
| Weekly Performance | -6.41% |
| Monthly Performance | -27.55% |
| RSI (Relative Strength Index) | 35.1 |
| ADX (Average Directional Index) | 24.5 |
| MACD (MACD Level) | -2.21 |
| CCI (Commodity Channel Index, 20-period) | -147.18 |
RSI Rebounds From Extreme Oversold Territory – First Green Signal Since November
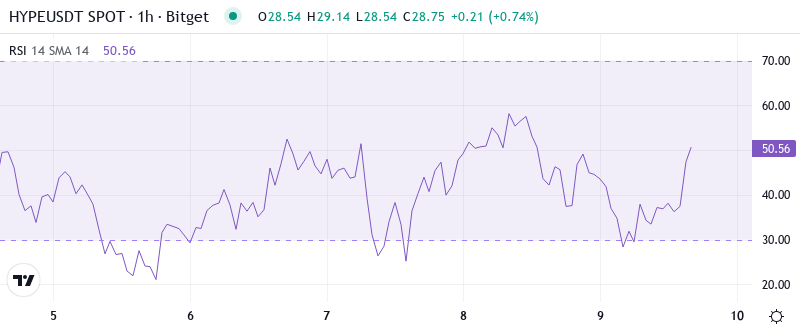
Reading the oscillator at 35.08 on the daily timeframe, HYPE has climbed out of the danger zone below 30 where capitulation typically peaks. This marks the first meaningful momentum recovery since the token plunged from its all-time high near $43, with RSI spending most of December pinned in oversold territory as sellers dominated every bounce attempt.
Similar oversold bounces in volatile DeFi tokens often produce 20-30% relief rallies before meeting resistance, and HYPE’s current setup mirrors these historical patterns. So for swing traders, this momentum reset combined with the fundamental catalyst of the buyback program suggests room for continuation toward the 50 RSI level, which would coincide with price testing the $33-35 resistance zone where the 20-day EMA lurks.
ADX at 24.46 Signals Early Trend Emergence From Month-Long Chop
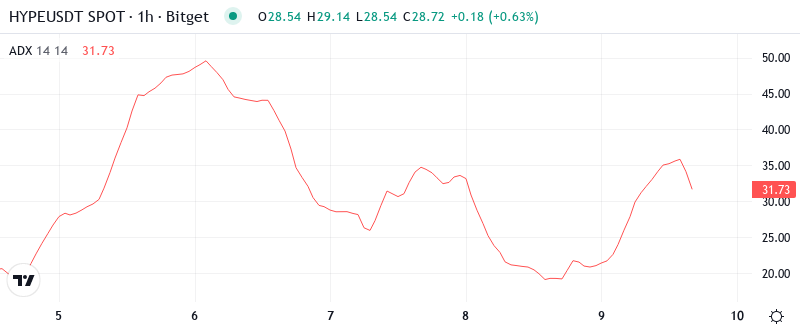
Trend strength measurements show ADX climbing through the crucial 20 threshold to reach 24.46, indicating the market is transitioning from December’s grinding consolidation into directional movement. Basically, being in this zone means day traders can start deploying trend-following strategies rather than the range-bound tactics that dominated the past month when ADX languished below 20.
What’s particularly revealing is how quickly ADX accelerated once the buyback news hit – jumping from the mid-teens to current levels in just days. To clarify, this rapid shift in trend dynamics often marks the early stages of a larger move, though traders should note that ADX below 25 still suggests the trend hasn’t reached full maturity. Therefore, positioning should remain measured until ADX confirms strength above 30.
20-Day EMA at $32.96 Becomes First Major Resistance After Supporting November Rally
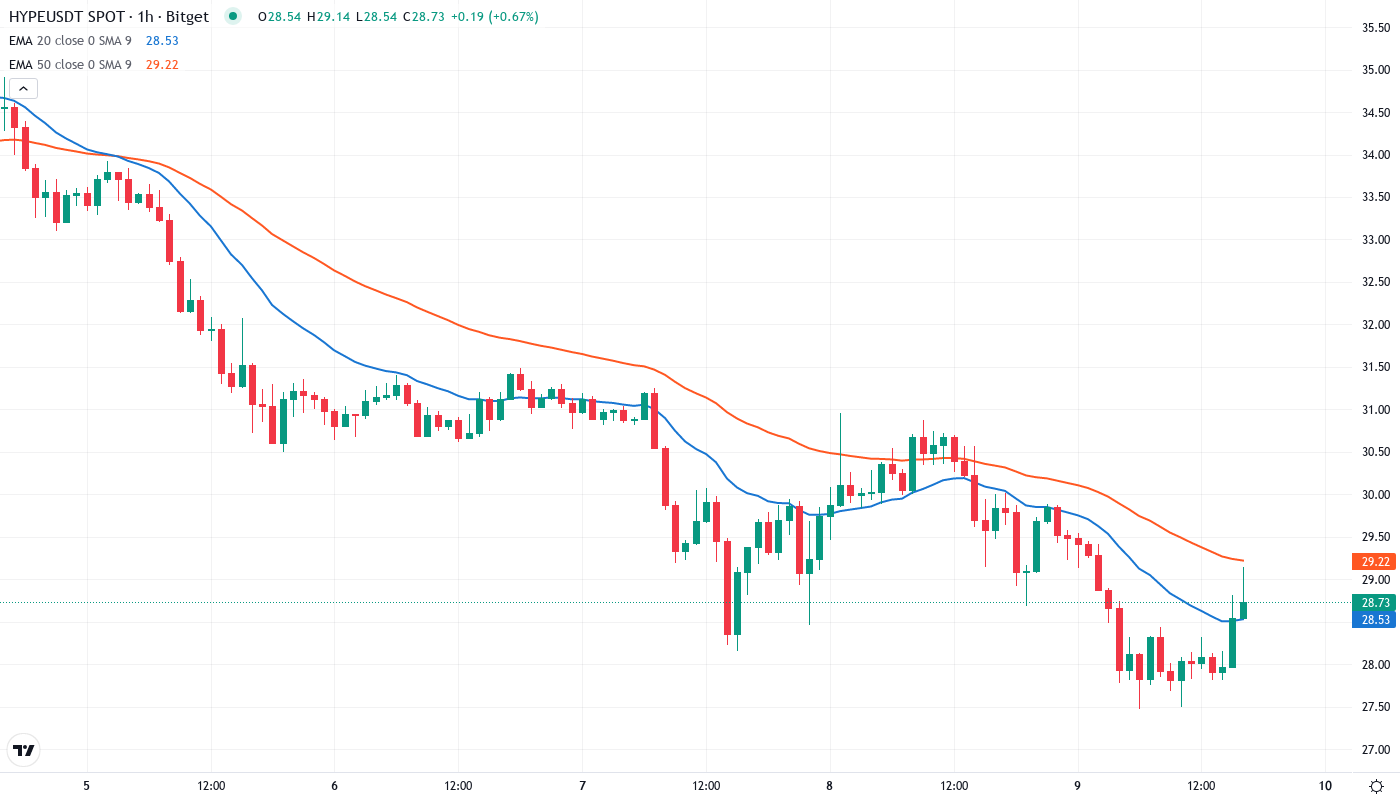
Price action through the moving average structure tells a clear story of recovery attempts. HYPE currently trades below the entire EMA ribbon, with immediate resistance stacked at the 10-day ($31.33), 20-day ($32.96), and the more substantial 50-day EMA at $39.05. The 20-day EMA particularly stands out, having flipped from support to resistance during December’s washout. More telling is the compression between current price ($29.06) and this resistance cluster – roughly a 13% gap to the 20-day EMA that typically acts as the first major hurdle in recovery attempts. The successful reclaim of this level would mark a critical shift in market structure, especially since it coincides with the psychological $33 level where profit-taking emerged during previous rallies. If USDC integration drives increased platform activity as expected, this technical resistance could transform back into support.
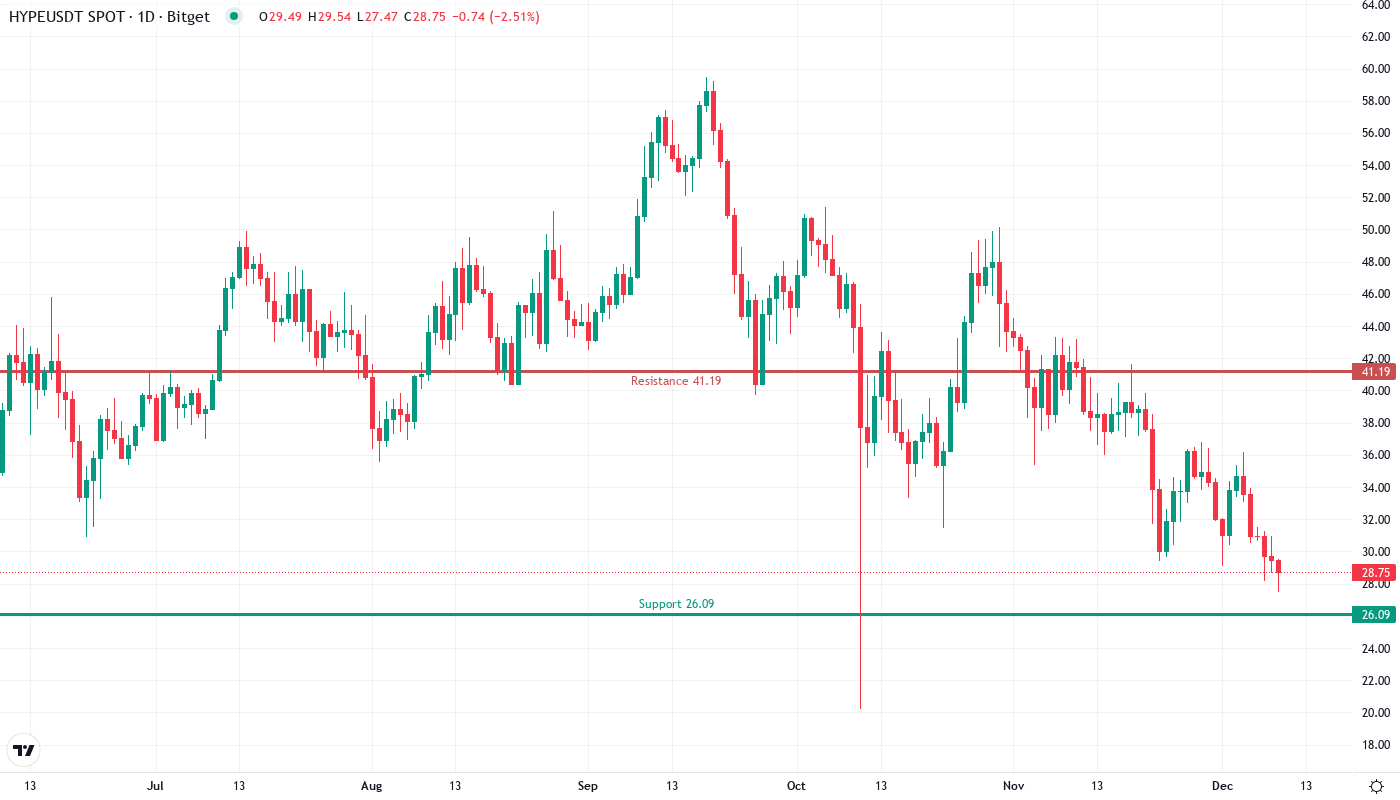
Resistance Stacks Between $32.96 and $39.05 While Support Builds at $27.47
Above current levels, sellers have fortified positions at multiple confluences. The immediate resistance zone spans from $31.33 (10-day EMA) through $32.96 (20-day EMA), with the monthly pivot at $35.29 adding another layer of overhead supply. This creates a formidable barrier that rejected three separate recovery attempts in December before the buyback announcement altered market dynamics.
Support architecture looks more constructive after this week’s bounce held the December low at $27.47. Bulls now guard this level as the line in the sand, with any daily close below likely triggering another wave of liquidations toward the $20 psychological level. The weekly pivot at $26.09 provides an intermediate cushion, but conviction buyers are clearly defending the $27.47 floor.
Market structure reveals an intriguing setup where the risk-reward favors bulls in the near term. The $30M buyback program provides a fundamental floor under price action while technical indicators reset from oversold extremes. This combination of catalysts and oversold bounce dynamics typically produces at least a retest of the 20-day EMA before sellers reassert control.
Bulls Target $33 as Buyback Program and USDC Integration Drive Recovery
Bulls require a decisive daily close above $32.96 to confirm the recovery thesis, which would flip the 20-day EMA back to support and open a measured move toward $39. The ongoing buyback program provides consistent bid-side pressure while USDC cross-chain functionality attracts new capital flows, creating the fundamental backdrop necessary for sustained upside.
Bearish invalidation triggers if HYPE loses $27.47 support on volume, particularly if it occurs despite active buyback operations. Such a breakdown would signal that selling pressure overwhelms even direct treasury intervention, likely cascading toward $20 as trapped longs capitulate. The absence of meaningful adoption metrics from the USDC integration would accelerate this scenario.
Given the oversold bounce dynamics, fundamental catalysts, and technical setup approaching key resistance, the most probable near-term path sees HYPE consolidating between $28-33 while digesting December’s decline. The buyback program should prevent immediate retests of support, allowing momentum indicators time to build strength before attempting the crucial break above the 20-day EMA that would confirm a larger recovery.