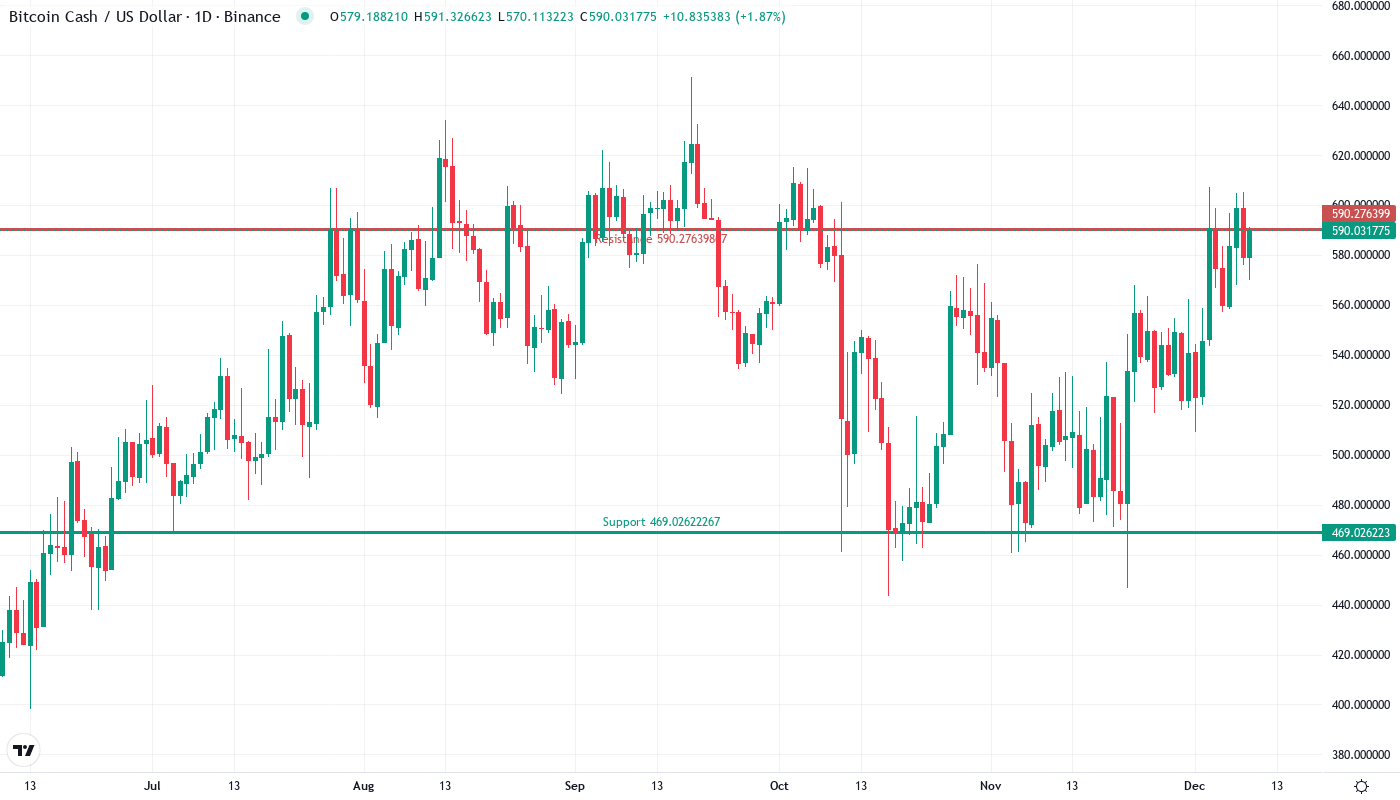
Bitcoin Cash Surges Past $589 as Bulls Eye Monthly Pivot at $639

Market Structure Shifts Higher
- Bitcoin Cash surged nearly 20% last week, outperforming major L1 competitors (Ethereum, Litecoin, Chainlink).
- BCH launched the first mature proof-of-work DeFi interface with a $200 million initial market cap.
- Technical-driven accumulation and high-velocity market participation signal bullish momentum.
Bitcoin Cash has enjoyed a near-20% climb over the last week, outperforming Ethereum, Litecoin, and Chainlink which we’ll refer to as “major L1 competitors,” in that same time frame.
Bitcoin Cash is the first mature proof of work cryptocurrency to launch a seamless interface for decentralized finance. The Bitcoin Cash Network has launched its catalyst for technical-driven accumulation, governance, mining decentralization, and non-custodial finance for the purpose of purchasing BCH. The Ethereum-compatible platform, based on smart contracts that have been professionally audited, had an initial market cap of approximately $200 million and was launched following a 2021 User Activated Protocol upgrade. Buyers have immediately snatched up the token with a bias to accumulate. The overall market has incorporated the abundance with high velocity.
| Metric | Value |
|---|---|
| Asset | BITCOIN CASH (BCH) |
| Current Price | $589.45 |
| Weekly Performance | 12.65% |
| Monthly Performance | 18.96% |
| RSI (Relative Strength Index) | 58.1 |
| ADX (Average Directional Index) | 25.9 |
| MACD (MACD Level) | 18.33 |
| CCI (Commodity Channel Index, 20-period) | 102.59 |
Momentum Holds Mid-Range as Bulls Control the Tempo
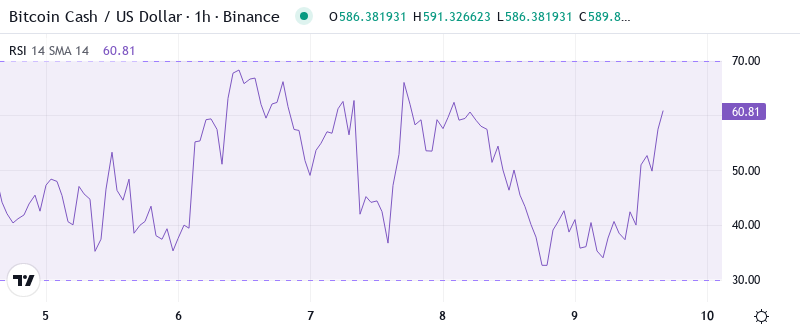
The Relative Strength Index is currently at 58.67 on the daily timeframe, which suggests balanced conditions with a slight bullish bias. At the end of December, the RSI began recovering from oversold levels below 30.00. What is noteworthy in particular, is that the surge in momentum has not led to extreme overbought conditions in the oscillator: the weekly RSI peaked at 61.30. This suggests that there is significant room for continuation without having to worry about exhaustion in the short term.
The same RSI readings we see now in October prefaced BCH’s $350 to $607 move, meaning the setup heavily encourages patient accumulation as opposed to all-out chasing. For swing traders, this controlled momentum will present attractive risk-reward entries in the vicinity of the 50-day EMA at around $540. Especially with bullish funding patterns on whales seen across crypto, the broader market should reaffirm this bullish environment.
ADX at 25.8 Signals Genuine Trend Strength Building
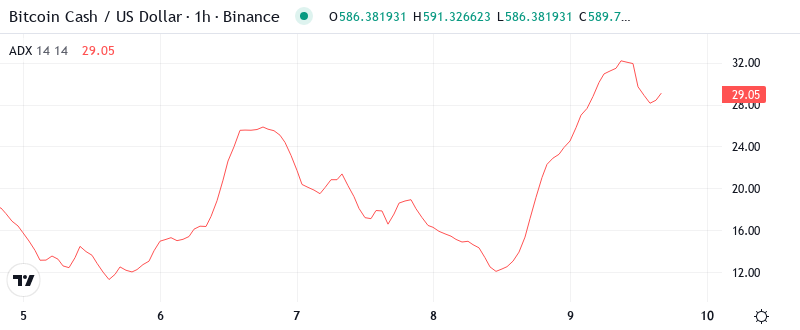
The ADX reading of 25.85 shows the strongest trend strength since the stock topped out in early September, and suggests that the most recent price swing may have further to run to the upside. Price momentum remains consistent with the bullish view, as both the 10-day and 30-day moving averages are in positive alignment, with the shorter-term average crossing above the longer-term average over multiple sessions through Monday.
In the prior week, this strengthening accumulated a pace with the broader institutional entry to the space – The National Bank of Canada’s MicroStrategy investment and December’s whale accumulation of 47,584 BTC, setting the perfect backdrop for BCH’s leadership L1 standout. As such, trend following longs via the daily structure should be given precedence over mean reversion until ADX falters north of 40 above.
50-Day EMA at $539 Transforms From Resistance to Critical Support
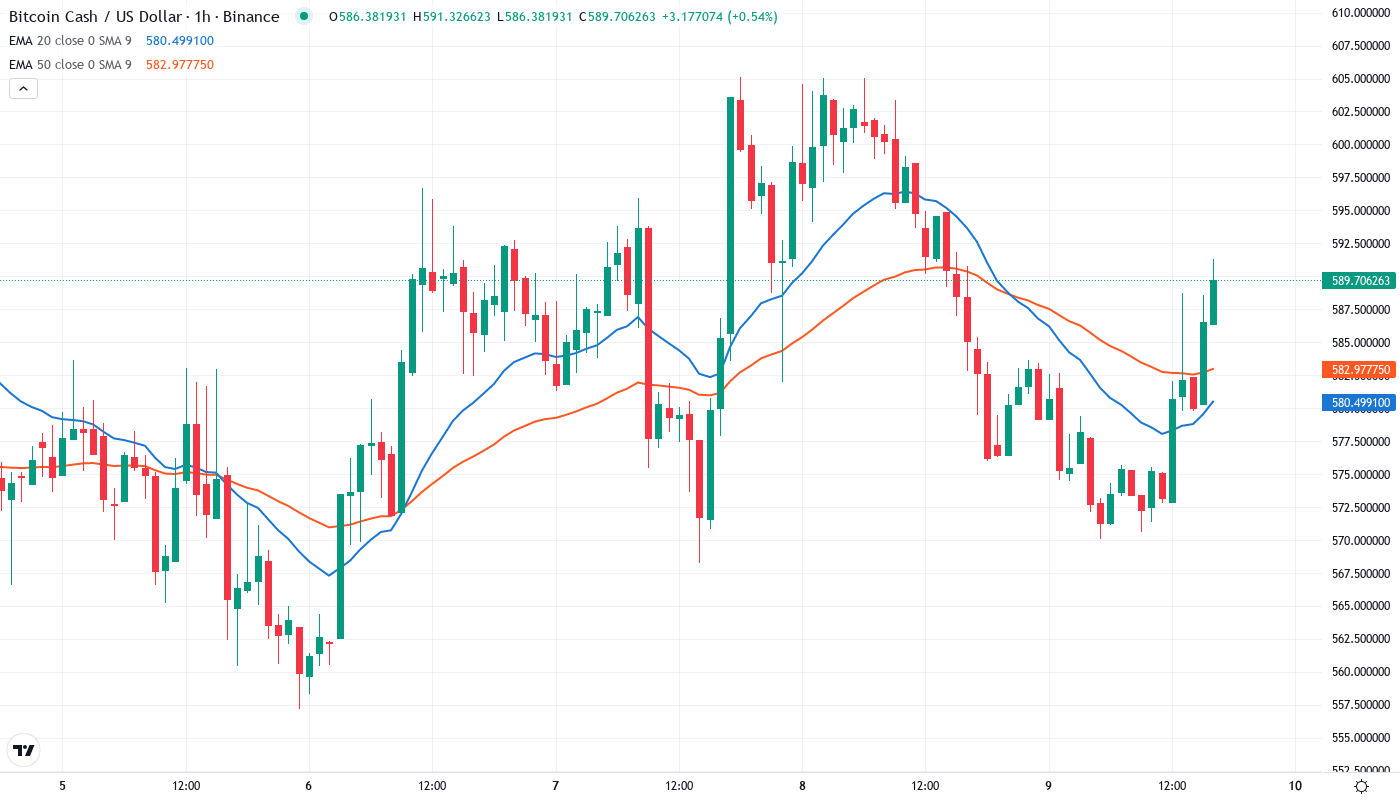
Looking at the indicators, the MACD (moving average convergence/divergence) is printing a positive reading for the first time since mid-July, while the RSI (relative strength index) hovers in overbought territory at 72. A quick about-face and drop back below the 50-day EMA would signal a false break higher and could yield a pullback to $500. Beyond that, the 100-day EMA lies at $484.
The standout feature is the compression between the short-term averages, with the 10-day through 30-day EMAs lying closely together in a $571 to $546 range. As the market coils before its next move, this is the kind of setup that has lead us to refer to our long-term chart (the last time was 2010). The previous resistance at $539 is now a line in the sand for the bulls to hold, with a close below it on any day indicating the first meaningful trip-up in the rally.
Resistance Stacks Between $607 December Peak and $639 Monthly Pivot
A psychological level is a price level determined by factors apart from the asset’s market price but instead common reference points, such as previous highs or notable support levels.
Now that the recent rally has lost its luster, the bears are salivating at the thought of breaking lower to try and stamp out the sustained uptrend from the mid-March panic low. They must navigate through the support levels the bulls have established first.
Importantly, the market structure is still positive as long as BCH remains above $539 on a pullback (which coincides with the 38.2% Fibonacci retracement of the recent move). The next big target would be the monthly pivot at $639 after $607 is taken out. This would also drive in participants that missed the first rally leg in December.
Bulls Need Conviction Close Above $607 to Unlock $639 Target
If BCH can secure a daily close above $607 with an increase in volume, it could pave the way for the monthly R1 pivot at $639. The market leadership narrative of BCH, combined with institutional investments in crypto, acts as a solid fundamental catalyst for this breakout, especially if we consider the whale accumulation in the backdrop of late January.
If sellers keep climbing, the beta resistance level of $579 might halt the rebound. If the uptrend prevails, breaching $640 unlocks the all-time high. However, the stochastic RSI indicator suggests the rally is overbought and price could reverse soon.
With BCH’s dominating 19% weekly increase and the built support setup, consolidation between $570 and $607 is the most likely short-term situation as the uptrend continues to the next level around $639.