Bitcoin Cash Surges 15.7% Weekly as Bulls Eye $600 Resistance After Momentum Reset

Market Structure Moves Higher
- BCH jumped 15.7% over the past week, outpacing major L1 competitors in early 2025
- Technical momentum resets from overbought extremes while price holds above key moving averages
- Bulls defend $540 support through multiple tests, setting stage for next leg higher
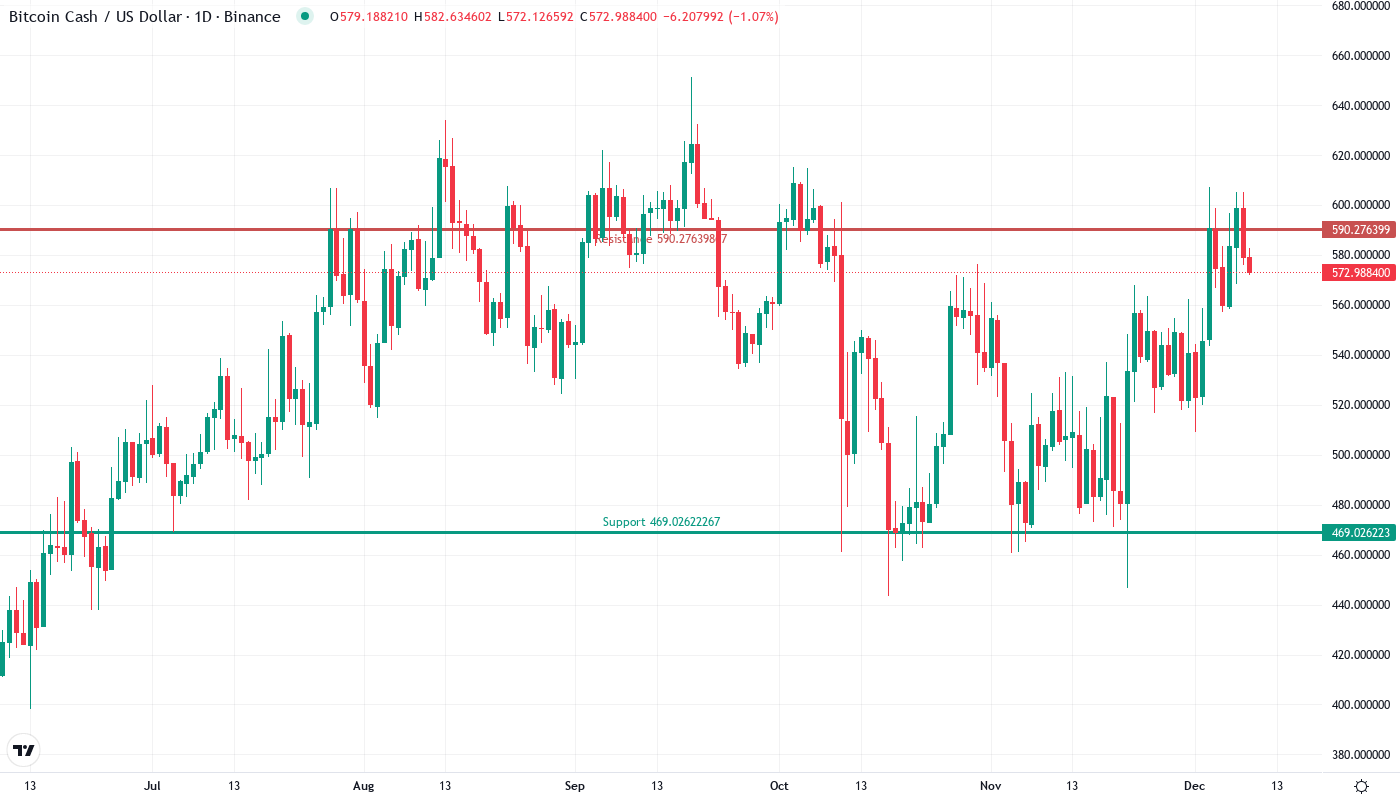
Bitcoin Cash kick-started 2025 with a convincing 15.7% weekly surge, darting through resistance levels and leading all major Layer 1 blockchains in performance. The move from $495 to current levels near $573 came as broader crypto markets caught wind of BCH’s relative strength narrative, with the coin adding 33.7% over three months despite a slight monthly pullback of 1.2%. The main question for traders is: can BCH sustain this momentum push above $600, or will sellers emerge at December’s high of $607?
| Metric | Value |
|---|---|
| Asset | BITCOIN CASH (BCH) |
| Current Price | $573.39 |
| Weekly Performance | 9.58% |
| Monthly Performance | 15.72% |
| RSI (Relative Strength Index) | 55.3 |
| ADX (Average Directional Index) | 26.0 |
| MACD (MACD Level) | 17.05 |
| CCI (Commodity Channel Index, 20-period) | 82.29 |
Momentum Cools From 70s Without Capitulation Signal
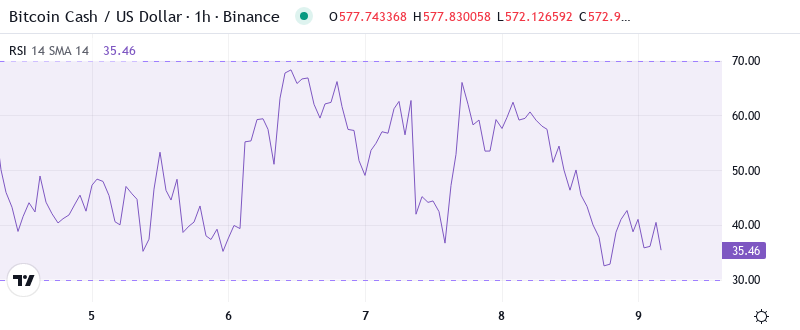
RSI sits at 55.27 on the daily timeframe, marking a healthy reset from the overbought readings above 70 that characterized December’s rally. This pullback in momentum occurred without price breaking key support levels – a constructive sign that suggests profit-taking rather than genuine selling pressure. Similar RSI configurations in September preceded multi-week consolidation phases before eventual continuation higher.
So for swing traders, this balanced RSI means entries carry less risk of immediate reversal compared to chasing at 70+ readings. The oscillator’s ability to hold above 50 during the recent price consolidation reinforces that bulls maintain control of the broader trend structure. With BCH leading major L1s in 2025 performance according to recent data, the momentum reset positions the market for sustainable moves rather than blow-off tops.
ADX at 25.98 Signals Shift From Chop to Trending Conditions
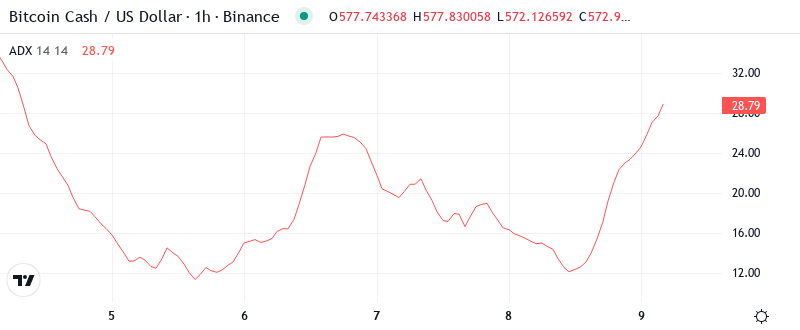
Looking at trend strength, the ADX climbed past the crucial 25 threshold, indicating markets are transitioning from range-bound behavior into directional movement. At the level of 25.98, the ADX entry indicates that the trend is gaining power but hasn’t reached extreme readings above 40 that often mark exhaustion phases. Basically, being in this zone suggests the primary trend has room to extend before hitting overbought extremes.
Therefore, trend-following strategies gain edge over mean reversion approaches in current conditions. The ADX acceleration coincides with BCH’s breakout performance relative to other Layer 1 blockchains, suggesting institutional flows may be rotating into the asset. Historical patterns show ADX readings between 25-35 often accompany the most profitable trending phases before volatility expansion occurs.
20-Day EMA at $553 Becomes Critical Support After December Break
Price action reveals a bullish structure through the EMA ribbons, with BCH trading above the 10-day ($568), 20-day ($553), and 50-day ($539) moving averages. The 20-day EMA proved particularly significant, transforming from resistance that capped advances in early December to support that caught this week’s pullback. This level rejected advances three times in December before bulls finally conquered it with conviction.
What’s more revealing is the compression between the 50-day ($539) and 100-day ($535) EMAs, creating a dense support zone that bulls now guard. That former resistance area at $540-553 transforms into a red line for the bulls to hold – any daily close below would signal potential trend exhaustion. The 200-day EMA sits distant at $514, offering final backstop support should near-term levels fail.
Resistance Stacks Between December High at $607 and Psychological $650
Above current price, sellers have fortified the zone from $590 to December’s peak at $607, where multiple rejections occurred during the last rally attempt. The psychological $600 level acts as the immediate barrier, with the actual December high at $607.24 representing the next major resistance. Should bulls clear this zone, the measured move target points toward $650-675 based on the recent consolidation pattern.
Bulls defend multiple support layers below, with the most critical zone spanning $540-553 where the 20-day and 50-day EMAs converge with horizontal support. The $540 level has attracted buyers on six separate occasions since November, building a case for reliable demand at these prices. Below that, the psychological $500 mark and 200-day EMA near $514 provide additional safety nets.
This market structure signals buyer control as long as BCH maintains above $540 on any retracement. The repeated defense of this level, combined with BCH’s sector-leading performance among Layer 1 blockchains, suggests accumulation rather than distribution patterns. Volume patterns confirm this thesis, with buying pressure intensifying on each test of support.
Bulls Need Daily Close Above $607 to Confirm Continuation
Should BCH secure a daily close above December’s high at $607, the path opens toward $650-675 targets while momentum from leading L1 performance provides the narrative catalyst. Bulls require volume confirmation on any breakout attempt, with ADX acceleration above 30 signaling genuine trend strength rather than false moves.
The bearish scenario triggers if price fails at $600-607 resistance and breaks below the crucial $540 support cluster on volume. This would trap recent buyers who entered on the “leading L1” narrative and likely cascade stops toward the 200-day EMA at $514. A daily close below $540 would shift market structure bearish and favor range trading strategies.
Given current momentum and BCH’s relative strength leadership, the most probable near-term path involves consolidation between $553-590 before another attempt at December highs. The constructive RSI reset and rising ADX support this continuation thesis, though traders should respect the $540 support as the line that separates bullish from bearish market structure.