Stellar Tests Critical Support After 15% Weekly Drop as Institutional Adoption Expands
Market Structure Shifts Lower
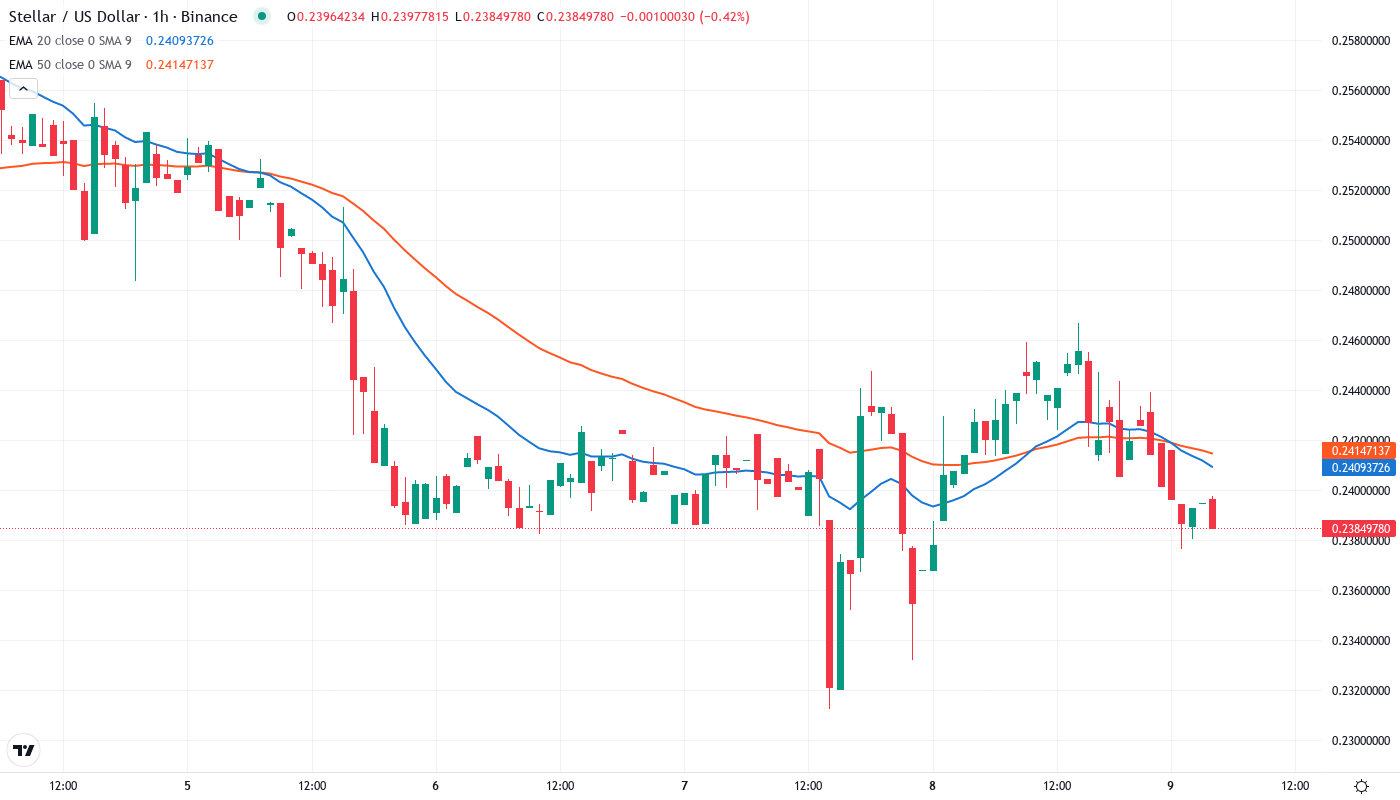
- After a 15.3% drop this week, XLM is testing a six-month support at $0.238.
- The launch of WisdomTree’s retail tokenized fund on the Stellar blockchain shows an increasing institutional interest in the blockchain and its technology.
- Stellar’s relative strength index has dropped to 40.8 which means that it’s nearing the oversold territory for the first time since the end of August.
Unfortunately, Stellar’s XLM token has shed 15.3% over the past week, tumbling from $0.282 to current levels near $0.238 as broader crypto markets face year-end profit-taking. The devastating drop came despite a generally positive announcement that WisdomTree planed to launch a tokenized fund on both the Ethereum and Stellar networks, suggesting the institutional adoption momentum couldn’t offset the technical breakdown. The main question for traders is: will the $0.238 support level that held throughout November provide another bounce, or are we headed for a deeper retracement toward $0.20?
| Metric | Value |
|---|---|
| Asset | STELLAR (XLM) |
| Current Price | $0.24 |
| Weekly Performance | 1.93% |
| Monthly Performance | -15.33% |
| RSI (Relative Strength Index) | 40.8 |
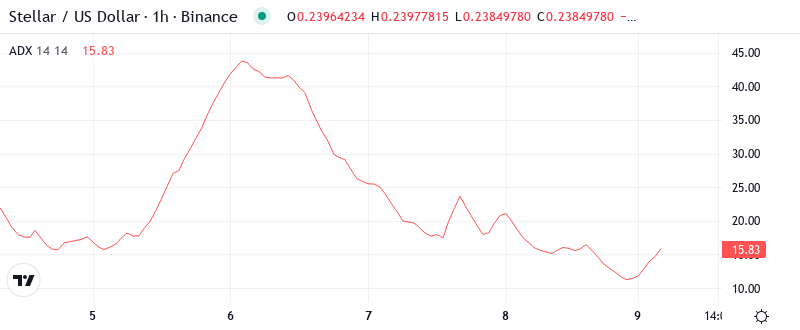
| ADX (Average Directional Index) | 31.0 |
| MACD (MACD Level) | -0.01 |
| CCI (Commodity Channel Index, 20-period) | -58.63 |
RSI Approaches Oversold Territory After Sharp Decline
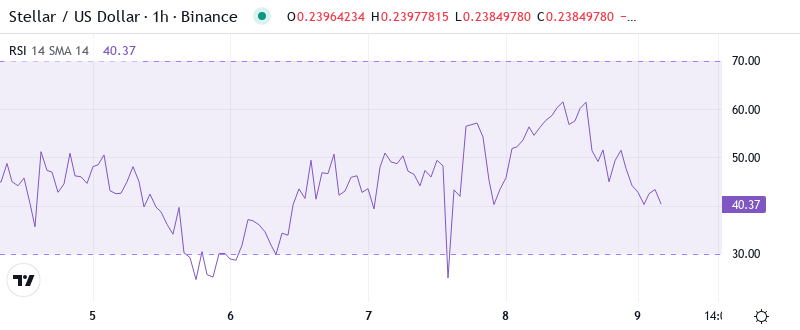
With the oscillator currently publishing one of its most extreme oversold readings of the year, volume is the only missing ingredient necessary to spark a similar snap-back rally. As the current selloff appears to have been largely exacerbated by thin pre-holiday trading conditions and the need to raise cash for retirement accounts, a good chunk of the sellers may have already left the pit. This could soon become evident if the market runs higher on lighter-than-average volume (indicating a lack of selling pressure) like it did last spring after early bulls were driven from their positions.
Therefore, all we are left to do is play the waiting game, paying close attention to the resistance level at $0.22. If that level breaks, it won’t necessarily be indicative of an immediate trend reversal given how numerous resistance levels will need to be perturbed prior to a bull case can be constructed.
ADX Signals Moderate Trend Strength as Sellers Take Control
With an entry signal and an increase in power behind the downtrend, another $200 is likely to fall relatively quickly. Profit targets should reside at the most recent lows near 30.75 and 30.43. The former level will buttress the rally off 30.07, while the latter will be an important low dating back to New Year’s Eve. Buyers can take advantage of potential demand accumulation created below the latter level, and there won’t be much risk to it as stop-losses could be tight just below 30.40.
So, day traders need to play the trend and not expect the two-way action that characterized the market in early December. An increasing ADX coupled with price trading below all significant EMAs forms a classic trending scenario that continues until ADX comes near 40 or begins to diverge. In addition to the technical setup, there have been some positive fundamental updates such as the fund launch on the tokenized. But, as a momentum trader, you need to ride the prevalent downtrend unless the circumstances change.
Price Trapped Below Entire EMA Ribbon Since Breaking $0.256
If the 10-day EMA can find buying interest today, the next upside stop will likely be the 20-day EMA near $0.25. Be aware though; if the broader crypto market remains negative, the 10-day will very likely act as a magnet all day, and likely throughout the weekend as well.
What is most telling is that the 20-day EMA at $0.249 has rejected pullback attempts thrice this week. What was a strong support in the previous month can now be expected to act as a strong resistance. The 50-day EMA at $0.257 will now become the final point that the bulls will have to recapture in order to turn the tide in their favor. Hence, until then, both the EMAs will act as a cap and not a support base, indicating that rallies to this level between $0.249 and $0.257 can be used to initiate short positions.
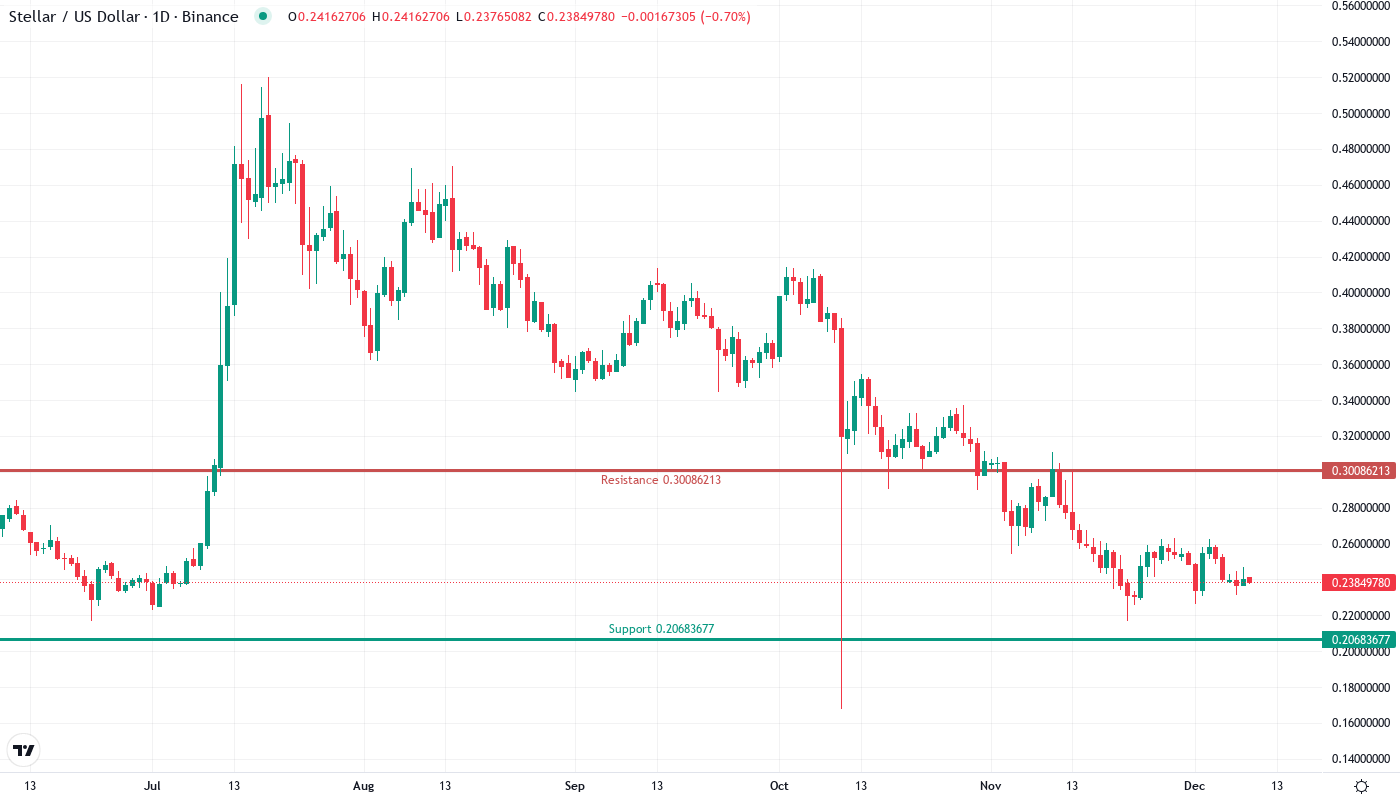
Support at $0.238 Faces Sixth Test Since June
The closest support centering around $0.238 has held firm over numerous market cycles. For the sixth time since June, bears tried to break through this level, but the pass trials resulted in 15-25% rebounds. There was notable accumulation around the level during the August sell-off. This support level is viewed by some institutional participants as an attractive entry point. This view is also corroborated by the choice of Stellar as the tokenized fund platform by WisdomTree.
Bullish investors protect several defenses under prevailing values, while a remote rearguard is given by the monthly S1 pivot of $0.207. Substantial $0.20 levels under the psychology just beneath is a 16% decrease from now, and would want to be traded to sell capitulation. Importantly, that location also indicates the confluence of the 200-week EMA, which is a high-probability turnaround applicant for patient dip purchasers.
The current market situation is quite different when you look at technical analysis versus the fundamentals. On the technical side, the price trend is bearish and there is an overall negative sentiment. However, if you look at the fundamentals in the news, there have been positive developments like tokenized funds that create a more optimistic picture for the future. This contrast is increasingly becoming more distinct.
Bulls Need Volume-Backed Reclaim of $0.257 to Reverse Damage
Buyers will then target the upper trendline of the falling wedge at $0.266 followed by $0.27, and the 2020 volume point of control at $0.276. The $0.276 break will herald the onset of the 40% retracement to $0.29. Given the size of the move, it’s unlikely to occur in one day. You do not want to be on the sidelines if it rips. Look to get in ahead of the 50-day EMA and build on strength.
The bearish scenario would be activated if the $0.238 level does not hold upon a rebound following this sixth retest. If it’s lost to the downside, the next monthly support is located at $0.207, with long-term support in the $0.20 region, where the 200-week EMA bar is close to settling. A $0.022 breakdown would wipe out 16% of gains from the November low and bring the price back to the starting line of recent market structure.
Based on the oversold momentum readings, significant historical support at current levels, and increasing real-world usage despite price softness, the most likely short-term trajectory has XLM ranging between $0.238-$0.257 into early January. This lateral consolidation phase would give the daily RSI room to recover from oversold territory as the 20-day EMA drops to the current price levels.