Dogecoin Tests Critical Support as Buenos Aires Adoption Sparks Recovery Hopes
Market Structure Shifts Higher
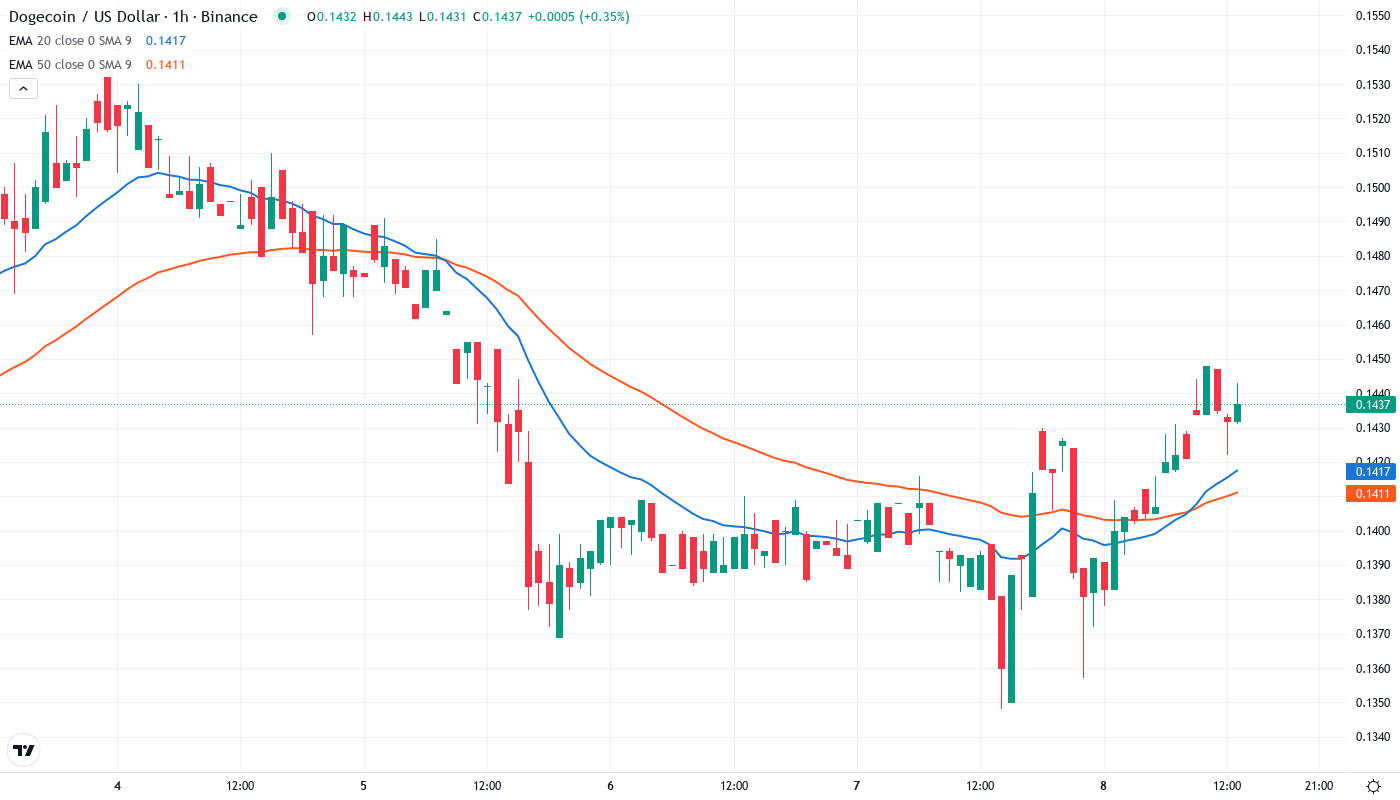
- Monthly low for DOGE set at $0.1319 following sudden pullback.
- News that the cryptocurrency would become a viable means of payment for residents in Buenos Aires.
- Built momentum across the space was interrupted.
The monthly low for DOGE was set at $0.1319 in the last week, as a sudden pullback followed shortly after the news that the cryptocurrency would become a viable means of payment for residents in Buenos Aires. The momentum that had been building across the space was interrupted.
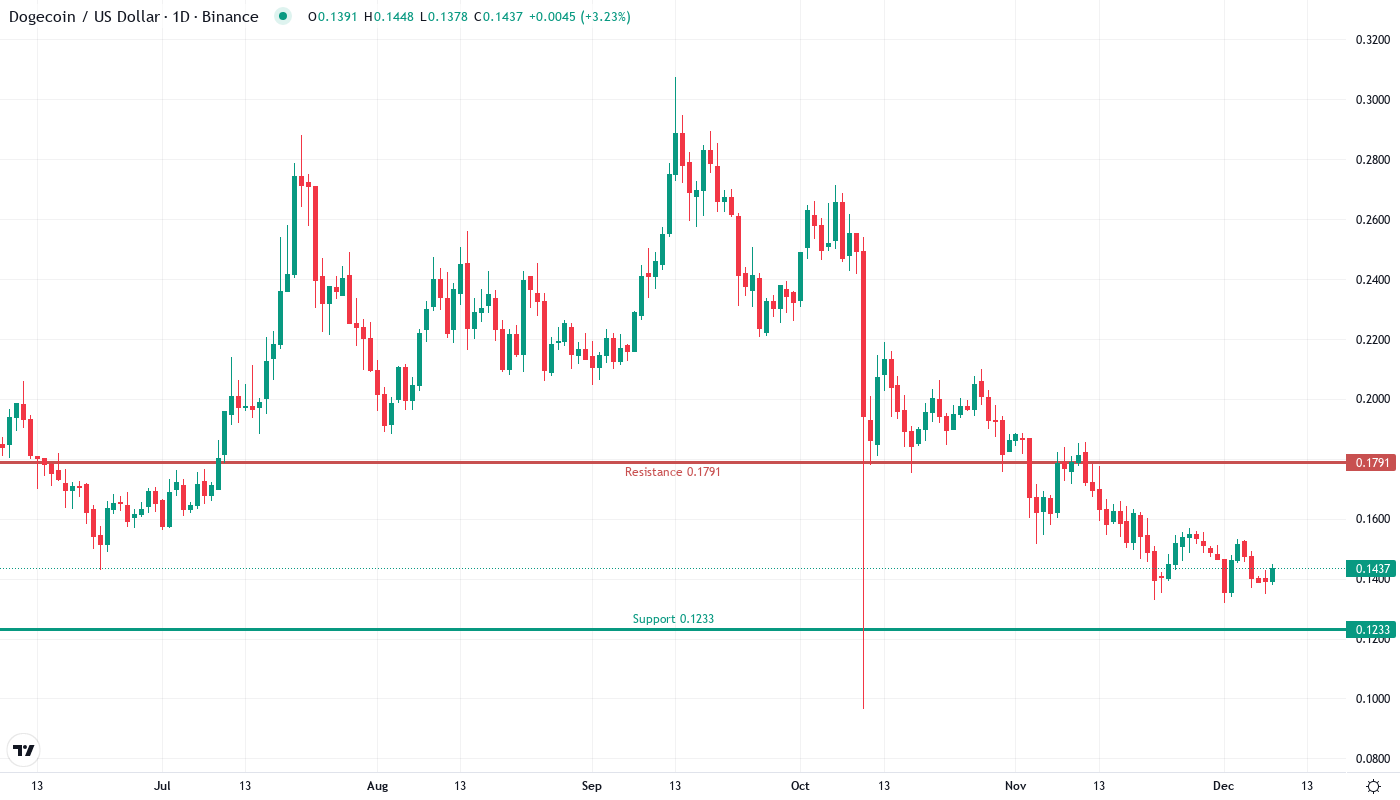
Dogecoin made a pretty good comeback from its lowest level in a month of $0.1319, the coin currently priced at $0.1438 as news that Buenos Aires will start accepting DOGE for tax payments breathed some new bullish life into the bruised altcoin. The token’s lost nearly 20% in the past 30 days and is 40.6% below its recent high, but the latest adoption news and 21Shares’ exchange-traded fund application shifted the overall market mood from completely negative to cautiously positive. The big question for fans is whether this news-driven rally can power the altcoin above that $0.15 make-or-break level it has failed to hold so many times since the December descent started in earnest.
| Metric | Value |
|---|---|
| Asset | DOGECOIN (DOGE) |
| Current Price | $0.14 |
| Weekly Performance | -1.78% |
| Monthly Performance | -19.57% |
| RSI (Relative Strength Index) | 42.9 |
| ADX (Average Directional Index) | 41.1 |
| MACD (MACD Level) | -0.01 |
| CCI (Commodity Channel Index, 20-period) | -57.64 |
Momentum Exhaustion Signals Capitulation Phase Complete at 42.93
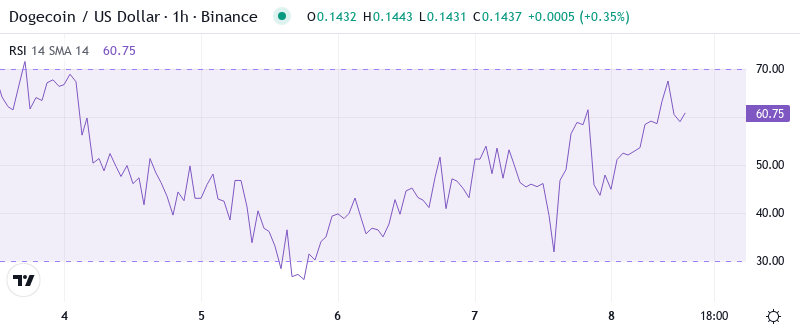
The Relative Strength Index reads 42.93 on the daily scale, where it rallied from oversold readings that rivaled levels not seen since August’s mass capitulation. From sub-30 to current neutral territory, it did so in the backdrop of the Buenos Aires news event, which indicates real demand rather than relief momentum.
What is interesting to note is how RSI reacted during the recent fall – it flashed bearish divergence since the price kept making lower highs and the momentum was not ready to confirm them, warning of the breakdown. As for swing traders, this neutral reset room could push upside momentum, particularly if the inverse head and shoulders pattern that technical experts keep an eye on the target at $0.40.
ADX at 41.06 Confirms Mature Downtrend Nearing Exhaustion Point
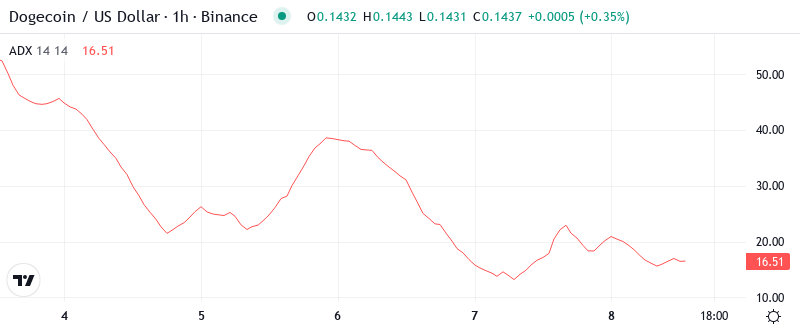
When the month ended on June 30, ADX was 41.06, signaling one of the most powerful trending moves in years, a trading strategy that dates from the 1980s where when ADX climbs over 40, it typically signals the exhaustion stage of a current trend. That is when late sellers throw in the towel, and smart money begins to accumulate.
The fact that Buenos Aires adopted DOGE and that 21Shares filed for an ETF during this high-ADX exhaustion phase isn’t random. Institutional actors frequently release positive news when the technicals are most conducive to loading up on cheap coins. So, expect extreme volatility as the powerful downtrend gives way to continuation or recovery — ADX is most likely subsiding from existing overbought extremes in any case.
50-Day EMA at $0.1661 Becomes First Major Test for Recovery
The EMA ribbon setup is squeezing tightly following this extended downturn, potentially ready to flip bearish imminently. This will depend a lot on where the 50-day average settles in the coming days and how many of the higher timeframe moving averages DOGE is going to be forced under.
In the last week, the 50-day EMA turned down forcedly three times and each time forced wounded soldiers to abandon, whereas a volume that climbed anxiety. To this end, the layout is now demanding DOGE to recapture a crucial resistance-turned-support level of $0.1661 to establish market structure in a bullish manner—the impeccable neckline for the suggested inverse head and shoulders design, the pattern traders gave a very bullish target of $0.40 for measured.
Support Architecture Builds From $0.1319 Low as Adoption News Reinforces Floor
There are many strong supports in the vicinity of $0.1319-$0.1428 levels. However, the level that bulls would ideally defend is the $0.15 price mark. A careful analysis of volume indicates that levels just under the Buenos Aires tax deadline lead to accumulation which shows that institutions are strengthening their positions.
There is strong resistance between the present price and the 50-day EMA at $0.1661, there is also a monthly pivot at $0.156, and the 100-day EMA at $0.1845 which also would be situating in prior support territory turned resistance throughout the December loss.
The market structure is interesting as the technical breach of $0.17 activates the inverse head and shoulders pattern from the technical reports with the first contract target of $0.40 being our high bidder. The pattern only remains valid as long as no weekly closes are seen under the $0.15 zone.
Bulls Require Convincing Close Above $0.1661 to Confirm Trend Reversal
If Dogecoin were to reclaim the 50-day EMA at $0.1661 with strong volume, the Inverse Head and Shoulders pattern triggers, which has the $0.40 handle in its crosshairs while the ETF speculation and real-world use case in Buenos Aires would be enough to keep the upside momentum going. Add in the technical pattern completion and institutional traction, and you might get a sizeable short-covering event based on the current setup.
If bulls maintain control and continue to set higher lows, XRP/USD will remain on track for potential further upside. Initial resistance lines up at $0.22 (September’s high and August’s low) but the real test would likely come at the $0.65 swing high in June as prior support often turns into resistance.
With all the adoption announcements, the ETF filing excitement, and oversold momentum spiking higher, more than likely DOGE just consolidates between $0.14-$0.17 for a while as all this soaks in and then it takes its best shot at the 50-day EMA. Be ready for volume to increase above average to signify a real recovery or else it’s just another bounce within a downtrend.