Bitcoin Cash Surges 40% to Lead Major L1 Performance in 2025
Market Structure Shifts Higher
- BCH climbs from $423 to $601 in three weeks, posting strongest L1 gains
- Momentum oscillators reset from overbought extremes, room to run higher
- Bulls defend critical $535 support after six successful tests since November
Bitcoin Cash has kick-started 2025 with a devastating surge, jumping 40.8% from December’s $427 low to current levels near $601. The move represents the strongest performance among major Layer 1 blockchains year-to-date, with BCH adding roughly $174 in just three weeks while broader crypto markets remained relatively subdued. The main question for traders is: can this explosive momentum sustain above the psychological $600 level, or will profit-taking emerge at these extended prices?
| Metric | Value |
|---|---|
| Asset | BITCOIN CASH (BCH) |
| Current Price | $600.74 |
| Weekly Performance | 11.07% |
| Monthly Performance | 17.23% |
| RSI (Relative Strength Index) | 61.1 |
| ADX (Average Directional Index) | 25.1 |
| MACD (MACD Level) | 19.30 |
| CCI (Commodity Channel Index, 20-period) | 157.93 |
Momentum Cools From 87 Without Capitulation Signal
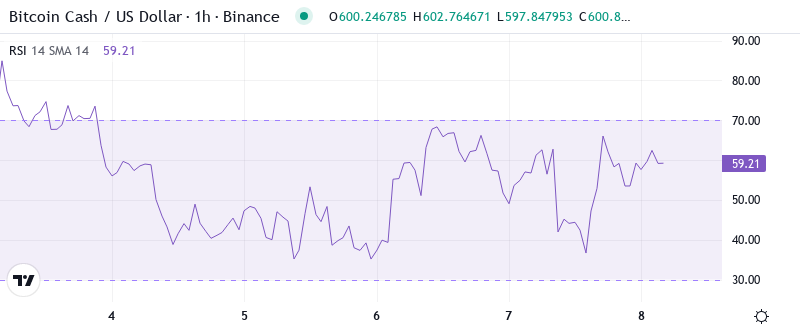
RSI sits at 58.91 on the daily timeframe, marking a healthy reset from last week’s overbought extreme of 87.13. Basically, the oscillator has cooled off significantly without BCH experiencing any meaningful price correction – a textbook sign of genuine trend strength building. Similar RSI configurations in September preceded another 25% leg higher once the oscillator found equilibrium around the 55-60 zone.
So for swing traders, this balanced RSI means the rally has room to extend without immediately hitting exhaustion territory. The weekly RSI at 61.08 confirms the broader uptrend remains intact, while the monthly reading at 58.78 suggests BCH hasn’t even approached the kind of euphoric extremes that marked previous cycle tops. It is worth mentioning that the last time daily RSI reset from above 85 to near 60 without price breaking down, BCH rallied another $180 over the following six weeks.
ADX at 25.12 Signals Shift From Consolidation to Trending Market
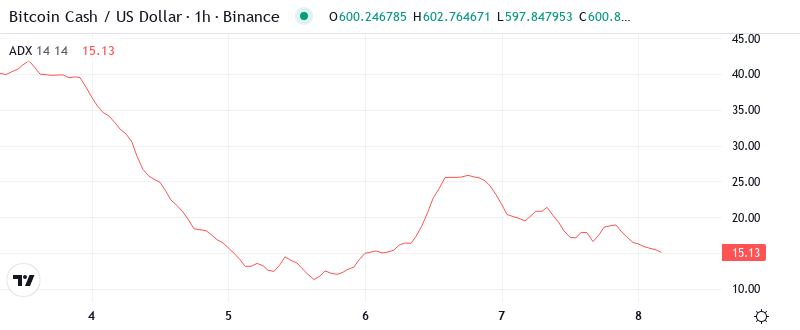
At the level of 25.12, the ADX reading indicates trend strength has crossed the critical threshold separating choppy conditions from directional moves. The indicator climbed from 18 just two weeks ago, confirming that BCH’s 40% surge represents a genuine trending state rather than another failed breakout attempt. To clarify, when ADX pushes through 25 after extended consolidation, it typically signals the early stages of a sustained directional move.
Therefore, day traders should adjust their strategies from mean reversion to trend following approaches. The monthly ADX at 23.28 suggests the longer timeframe trend still has room to accelerate, particularly if BCH can hold above the $535-540 support zone that’s been tested six times since November. Historically, BCH trends have sustained ADX readings above 30 for weeks during major rallies, meaning current levels may represent just the beginning of this trending phase.
20-Day EMA at $554 Becomes Critical Support After January Surge
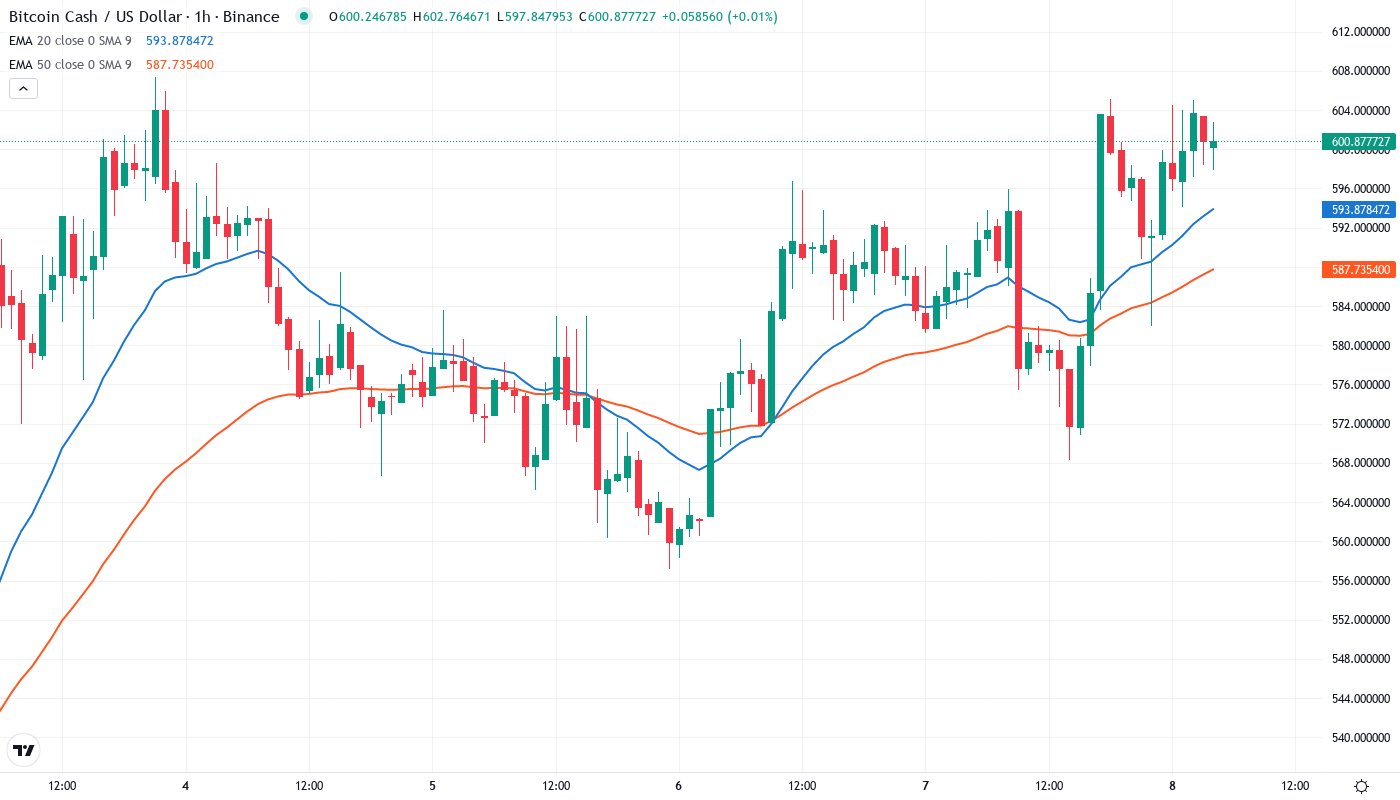
Price action through the EMA ribbons tells a compelling story of trend acceleration. BCH currently trades above the entire moving average stack – sitting comfortably above the 10-day ($571), 20-day ($554), and crucially, the 50-day EMA at $540. The 20-day EMA changed from being a resistance level to a support one during the December 28th breakout, and this level has already provided two successful bounces during minor pullbacks.
What’s particularly revealing is the compression between the 50-day ($540) and 100-day ($538) EMAs, which BCH convincingly cleared in a single daily candle. That former resistance cluster at $535-540 now transforms into a red line for the bulls to hold – lose this zone and the entire rally structure comes into question. The 200-day EMA remains distant at $514, providing a safety net roughly $87 below current prices should any black swan events trigger broader market liquidations.
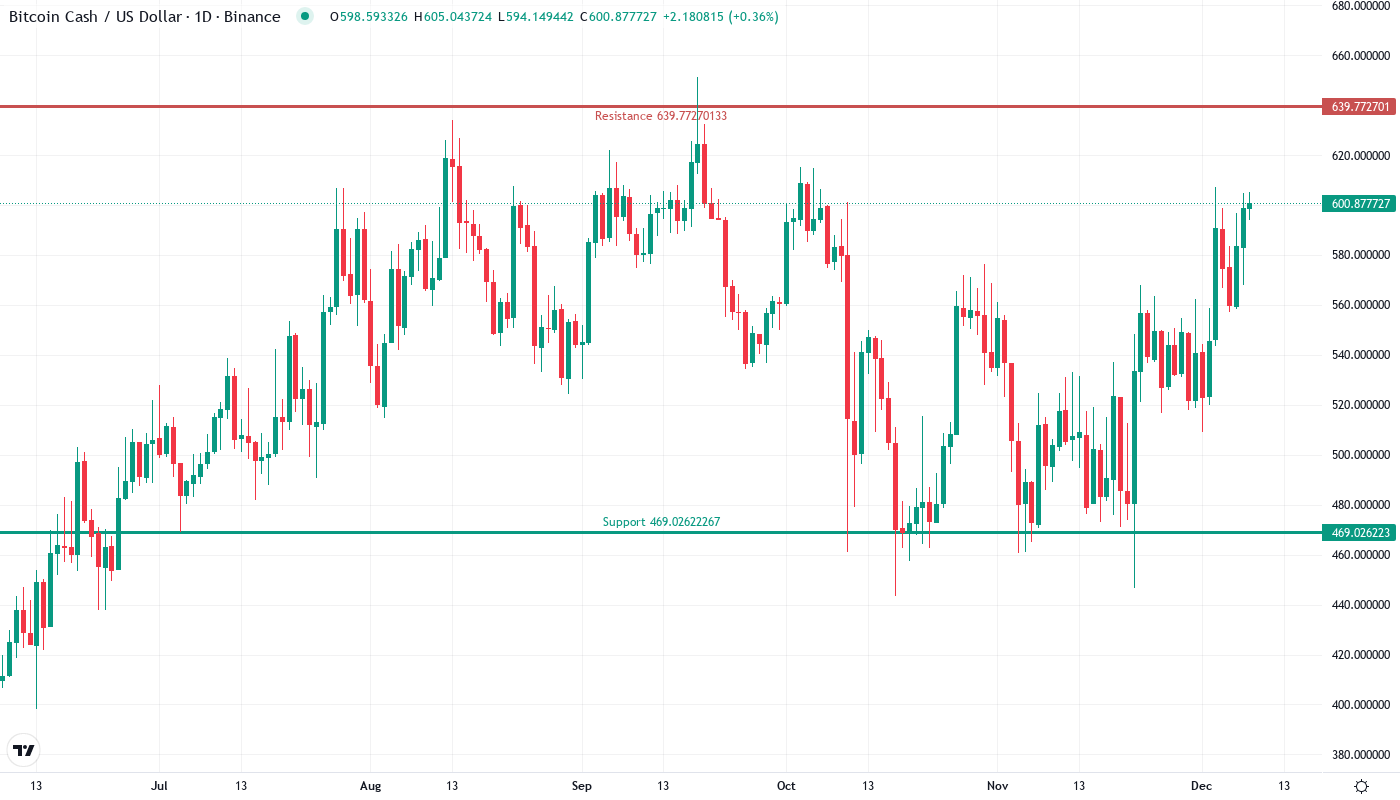
Resistance Stacks Between $639 and $761 as BCH Tests Yearly Highs
Above current levels, sellers have fortified multiple resistance zones that coincide with both technical and psychological barriers. The immediate resistance sits at $607 where December’s monthly high converges with the weekly R1 pivot at $639. This zone rejected advances twice in early December before BCH consolidated lower, making it the first major test for continuation of the current rally.
Bulls now defend multiple support layers thanks to the three-week surge that flipped several key levels. The $535-540 zone represents the most critical support, reinforced by both the 50-day and 100-day EMAs clustering in this area. Below that, the monthly pivot at $518 offers secondary support, though any daily close below $514 would likely trigger stop-loss cascades and shift market structure bearish.
The market architecture reveals buyer control as long as BCH maintains above $535 on any retracement. The monthly R3 pivot at $761 marks the extended target should bulls clear immediate resistance, representing another 26% upside from current levels. Crucially, the fact that BCH has tested and held the $535 support six times since November suggests strong institutional interest at these levels, likely tied to the broader narrative of BCH leading L1 performance metrics in 2025.
Bulls Need Daily Close Above $607 to Confirm Next Leg Higher
Should BCH secure a daily close above $607, the path opens toward $639 and potentially the $761 monthly R3 target. The combination of reset momentum indicators and BCH’s position as the top-performing L1 provides fundamental catalysts for continuation, particularly if broader crypto markets catch a bid from institutional flows returning in Q1.
The bearish scenario triggers if price gets rejected hard at $607 and loses the $535-540 support cluster on volume. Such a breakdown would trap recent breakout buyers and likely flush positions down to the 200-day EMA at $514, erasing roughly half the recent gains. A sustained break below $514 would shift the intermediate trend bearish and put the December lows near $423 back in play.
Given the technical setup and BCH’s relative strength leadership among Layer 1s, the most probable near-term outcome sees consolidation between $570-607 before another attempt at yearly highs. The reset in momentum indicators from overbought extremes, combined with the successful defense of key support levels, suggests the rally has further to run once this pause completes.