Solana Tests Critical Support at $133 as Western Union Partnership Fails to Halt December Slide

Market Pulse
- News of a stablecoin by Western Union set to launch in 2026
- SOL plummeted 14.3% this month
- Prices breached the 50-day and 100-day EMAs as support and slipped below the psychological $150 level
Solana started the year at $133.03, which was unfortunately 14.3% lower than a month ago and 35.6% lower than the local top. Not even the news of the partnership with the Western Union stablecoin, which usually raises crypto prices, has been able to stop the decrease in SOL prices by 2.2% this week. For traders, the main question is whether bulls can defend the psychological $130 level, or are we going to test December’s $121.77 low again?
| Metric | Value |
|---|---|
| Asset | SOLANA (SOL) |
| Current Price | $133.03 |
| Weekly Performance | -2.18% |
| Monthly Performance | -14.26% |
| RSI (Relative Strength Index) | 42.2 |
| ADX (Average Directional Index) | 34.3 |
| MACD (MACD Level) | -5.79 |
| CCI (Commodity Channel Index, 20-period) | -52.36 |
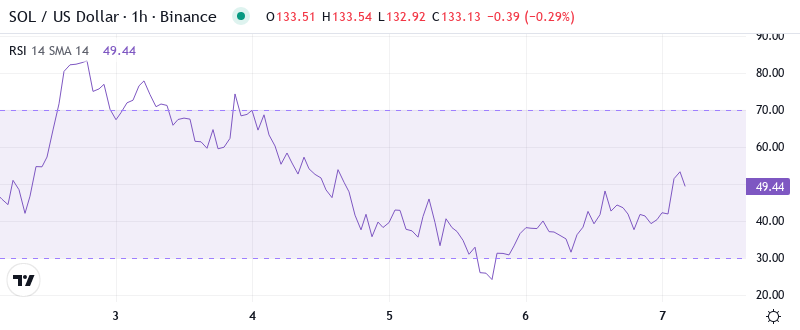
RSI Hovers at 42.56 – Neither Oversold Nor Ready to Rally
The 50 EMA at $147.50 provides an additional layer of resistance, potential friction in SOL’s immediate North-bound path. If the bulls can muster the necessary buying pressure to breach the converged resistance, the $226 marks an obvious bullish target due to the previous support level, May low-turned-high, and gap liquidity left behind during September’s breakdown confluence.
A significant point to note is that the relative strength index (or RSI) barely moved above the 45 level when news of the Revolut partnership was announced last week. For swing traders, it indicates that the positive catalyst did not generate enough momentum to push the prices higher, which means that there are more people willing to sell than to buy the stock at the moment. This also implies that any recovery in the stock price would be capped as the sellers will take that opportunity to offload shares. The RSI has to cross over the 50 mark before the stock has a fair chance of recovery.
ADX at 34.35 Confirms Bears Have Seized Control of the Trend
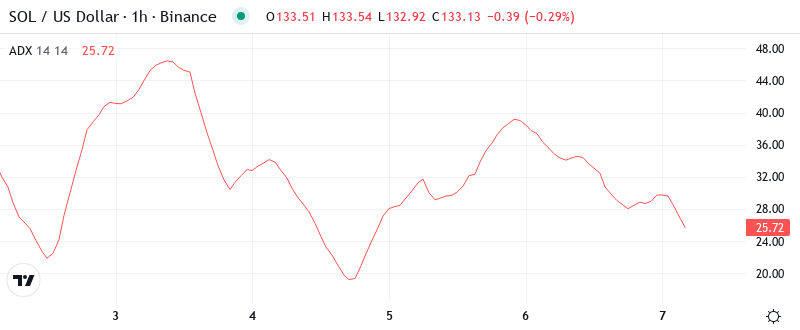
The strength of a trend can be measured. In this case, the trend has weakened slightly as time has passed, but essentially remains unchanged from when the episode began. SYSTEMATIC TRENDS. Systematic strategies just got the credit unwinding memo. Based on previous ADX configurations above 30, we usually see one more leg in the prevailing trend for about 15-20% before turning around. In other words, with ADX this high and rising, range traders are out of the game, and momentum traders are looking to add to shorts/exit longs for now – until we get a ADX curl back below 25.
Price Trapped Below Entire EMA Cloud Since Mid-December
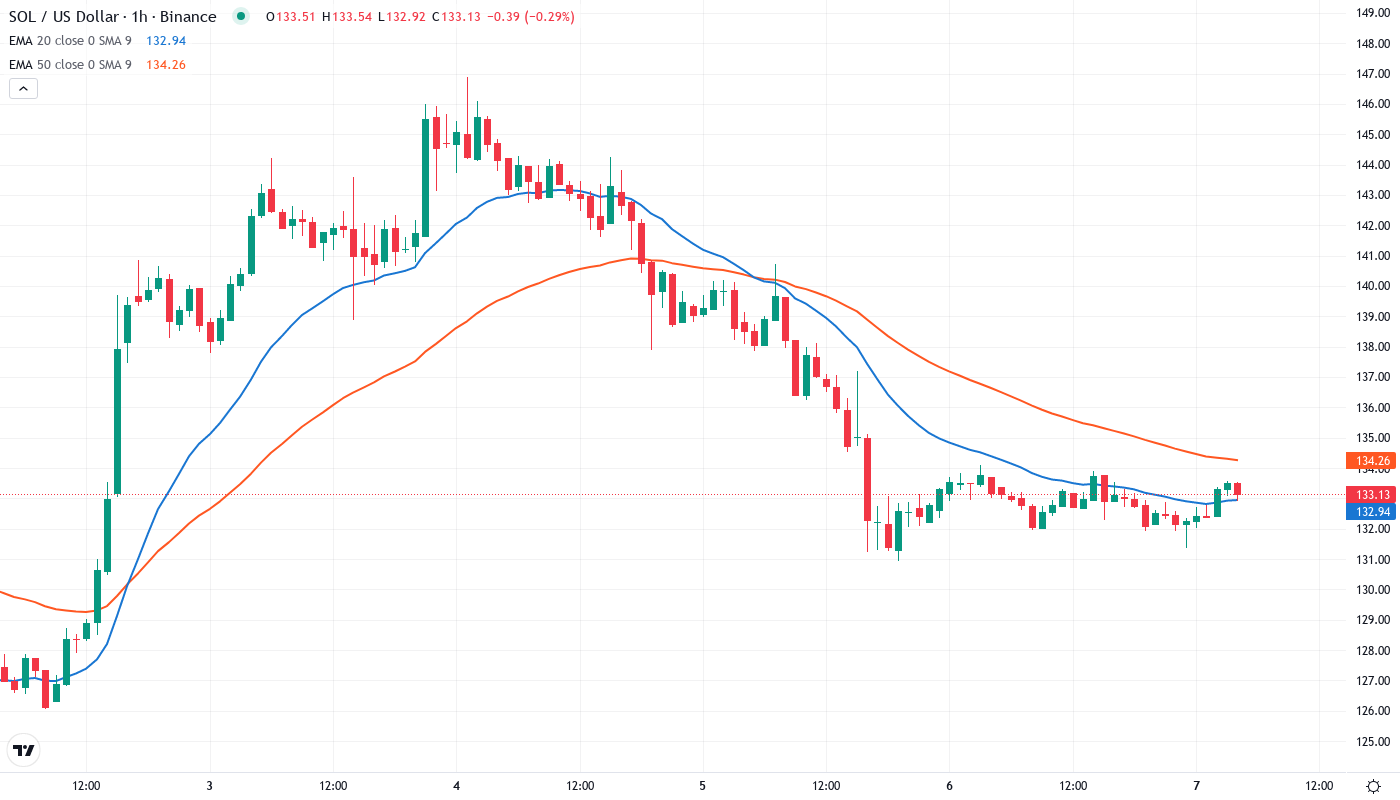
The moving average structure is horrendous for bulls. SOL is at $133.03, which is under the 10-day ($135.54), 20-day ($138.73), 50-day ($143.96), and notably the 100-day EMA at $154.63. Not even the Western Union partnership announcement could muster enough demand to recapture a solitary major average.
The most important aspect going forward is seeing whether the UNI/USD remains within this channel despite this ongoing downward trend. If so, the 50-day EMA will continue to decline sharply over the coming weeks and soon be in tandem with the lower bound of the channel. This potential confluence will shake traders out of this channel and be a probable area to maintain offers until further confirmation. A strong sign of trepidation will be when the trend line drawn from the May 19, 2021 local low is violated, which will continue to empty bullish wallets and set the stage for discussing much lower values and potential breaches of the August 2021 low.
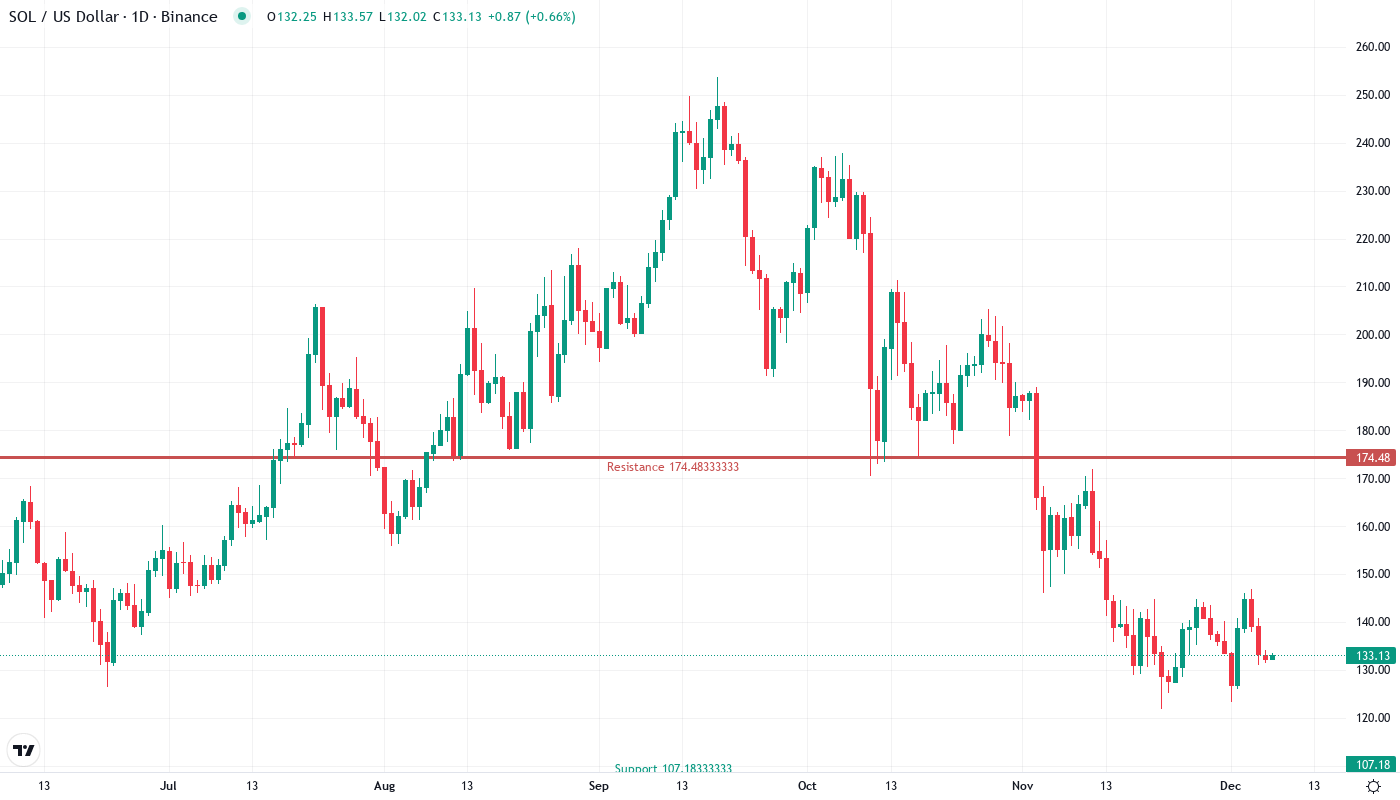
Support Crumbles at $140 While Resistance Stacks Up to $171
There are immediate resistance clusters between $143.96 (50-day EMA) and the monthly pivot at $148.13, with December’s failed breakout level at $154. Co-signing that resistance was Jupiter Exchange’s risk disclosure, which effectively placed the market lower-control arm of the death spiral on notice.
The Bulls really need to protect the $133 psychological level first, which is still a double digit percentage above the current price. More formidable support is not found until the December low at $121.77 as shown above. This would represent a total of 14.7% downside risk from Friday’s close, and this is where things get hairy…. as discussed last week, if this level were to break it is our belief that what follows is a very swift moving air pocket down to $115.63.
The structure is typical of a bear market: lower highs have been observed since the $171.83 monthly peak, there have been continuous failures at the long-term and short-term moving averages, and every small rally has been used as an opportunity to open new short positions. The constructive news about partnerships with Western Union and Revolut has not had an impact due to technical weakness.
Bulls Need Miracle Close Above $144 to Avoid December Low Retest
If SOL can recover the 50-day EMA at $143.96 in its daily candle, it could become the initial indication of selling fatigue and potentially promote shorts covering up to $154. The 2026 launch of Western Union’s stablecoin can be a recovery story, but it’s too far away.
Things will take a turn for the worse if the support at $133 is broken, especially since there is still negative sentiment due to the trust issues related to Jupiter Exchange. If this happens, the initial target will be the December low of $121.77, and it could further drop to $115 if that level is broken with substantial trading volume.
With the ADX eyeing a push over 30 and the RSI thrusting higher again the $1.345-$1.350 resistance zone will be front and center in USDT’s immediate term. If buyers can clear this area resistance the $1.38-1.39 area is the next hurdle before a run at the $1.45 all-time high. A struggle in the $1.38-1.39 area could lead to a slide back toward the $1.25-1.20 area.