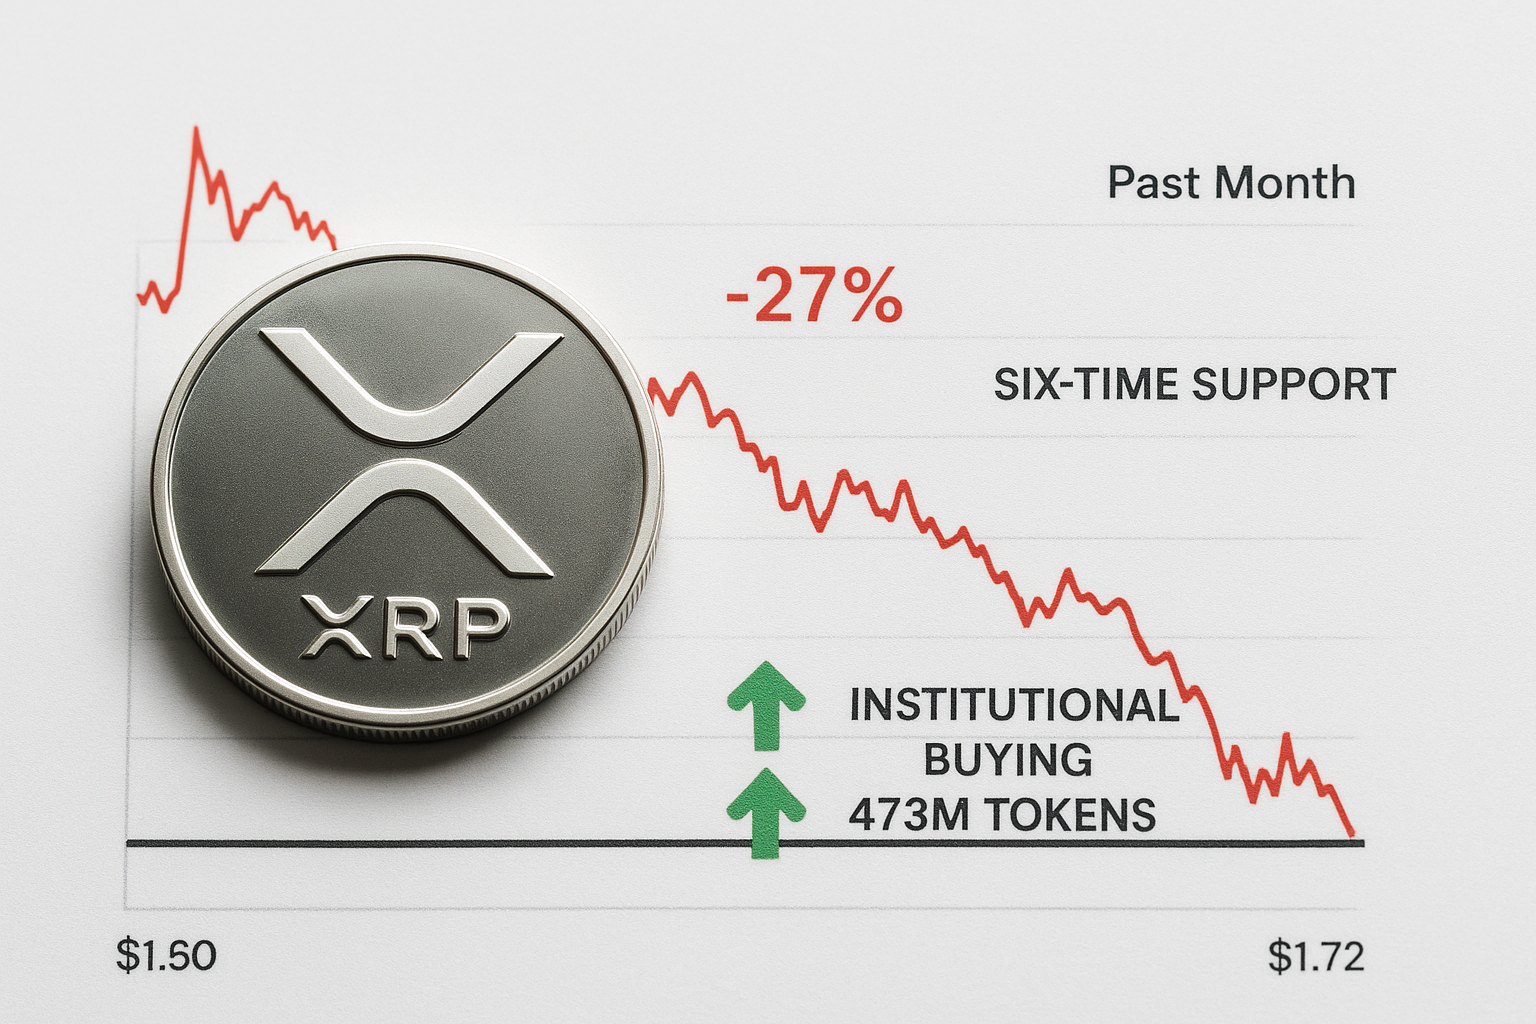
XRP Tests Six-Time Support at $1.72 as Institutions Scoop 473M Tokens Despite 27% Monthly Slide
Market Structure Shifts Lower
- XRP slides 27% from December highs yet holds above crucial $1.72 support tested six times since June
- Institutional buyers quietly accumulated 473 million tokens while retail sentiment turned bearish
- Technical indicators reset from overbought extremes, creating room for recovery if support holds
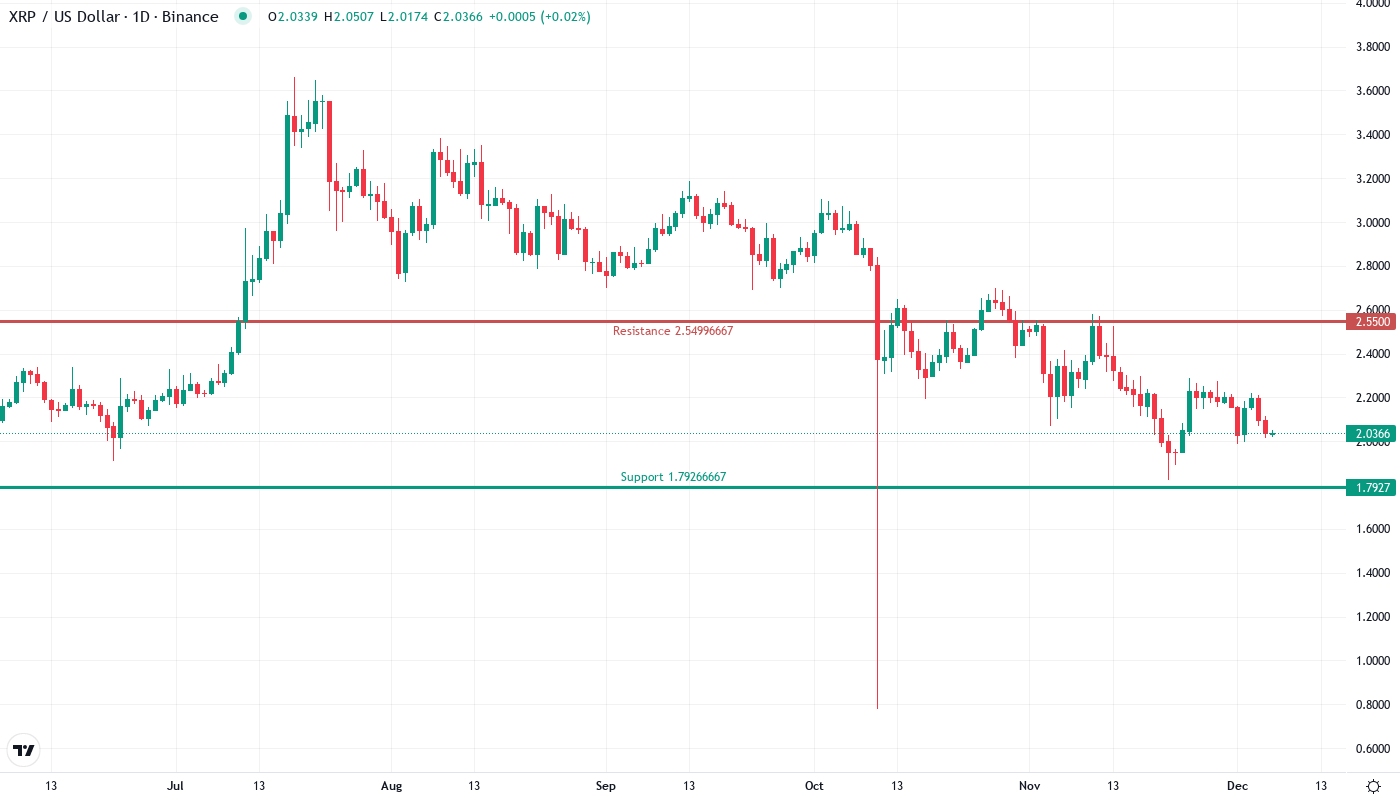
XRP’s devastating drop from $2.58 to current levels around $2.04 marks a 27% monthly decline that’s erased three weeks of gains and left traders questioning whether the correction has run its course. The sell-off accelerated after price failed to sustain above the psychological $2.50 level, triggering stop-loss cascades that drove momentum indicators from overbought territory back toward neutral readings. The main question for traders is: can bulls defend the $1.72 support that’s held firm through six separate tests since June, especially with institutions quietly accumulating 473 million tokens during this pullback?
| Metric | Value |
|---|---|
| Asset | XRP (XRP) |
| Current Price | $2.04 |
| Weekly Performance | -6.52% |
| Monthly Performance | -12.98% |
| RSI (Relative Strength Index) | 41.3 |
| ADX (Average Directional Index) | 23.0 |
| MACD (MACD Level) | -0.06 |
| CCI (Commodity Channel Index, 20-period) | -73.61 |
Momentum Resets to 41.3 After December’s Overbought Extreme
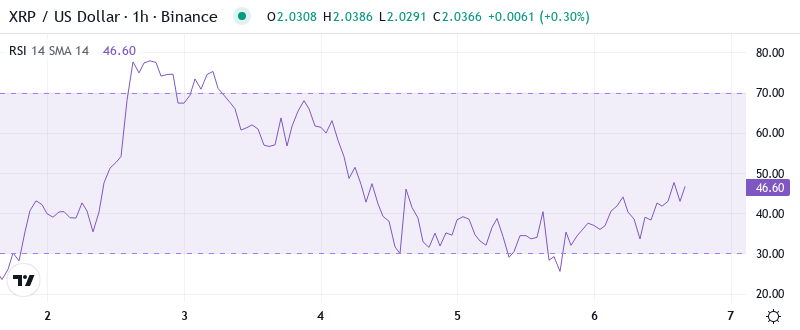
RSI sits at 41.3 on the daily timeframe, marking the first approach toward oversold conditions since the August washout that preceded XRP’s 180% rally. Reading the oscillator at this level, traders see momentum has reset from the extreme 75+ readings hit during December’s euphoric peak – precisely the kind of cooling period that often precedes sustainable moves higher. The sharp momentum shift coincided with profit-taking after XRP ETFs recorded $12.84M net inflows, suggesting early investors locked in gains while new institutional money entered at lower levels.
What’s revealing is how RSI behaved during previous tests of the $1.72 support zone – each bounce occurred with RSI between 35-42, creating a reliable pattern for swing traders to reference. Similar RSI configurations in September and November both resolved with 40%+ rallies once the oscillator confirmed a higher low above 40. So for swing traders, this balanced RSI reading combined with institutional accumulation suggests the selling pressure may be exhausting, though a break below 35 would signal deeper correction ahead toward the $1.43 level.
ADX at 23 Signals Shift From Sharp Decline to Potential Base-Building
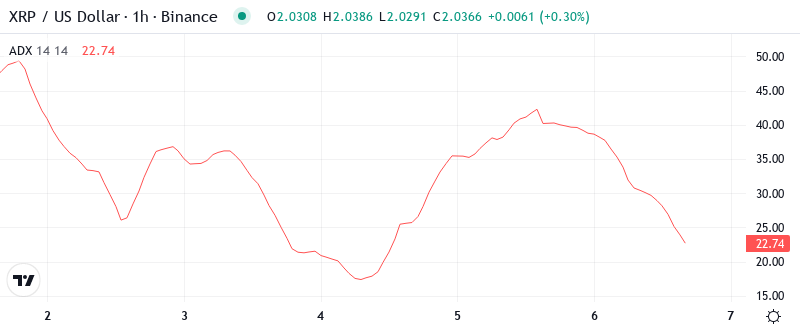
Looking at trend strength, the ADX reading of 23 indicates the powerful downtrend from December highs is losing steam but hasn’t fully reversed yet. During the steepest part of the decline, ADX climbed above 40 – showing conviction behind the selling – but has since retreated as price action shifted from vertical drops to sideways consolidation between $1.95-$2.15. This deceleration in trend strength often marks the transition phase where smart money positions ahead of the next directional move.
Basically, being in this ADX zone means we’re switching from trending conditions back toward a potential accumulation phase. The introduction of Smart Escrows on the XRP Ledger provides fundamental support for recovery, as these advanced conditional settlement features could drive increased utility demand once the technical picture stabilizes. Therefore, range traders should focus on the $1.95-$2.15 zone until ADX climbs back above 25 to signal the next trending move, while trend followers wait for confirmation of direction before deploying capital.
20-Day EMA at $2.15 Caps Recovery Attempts While 50-Day Holds at $2.29
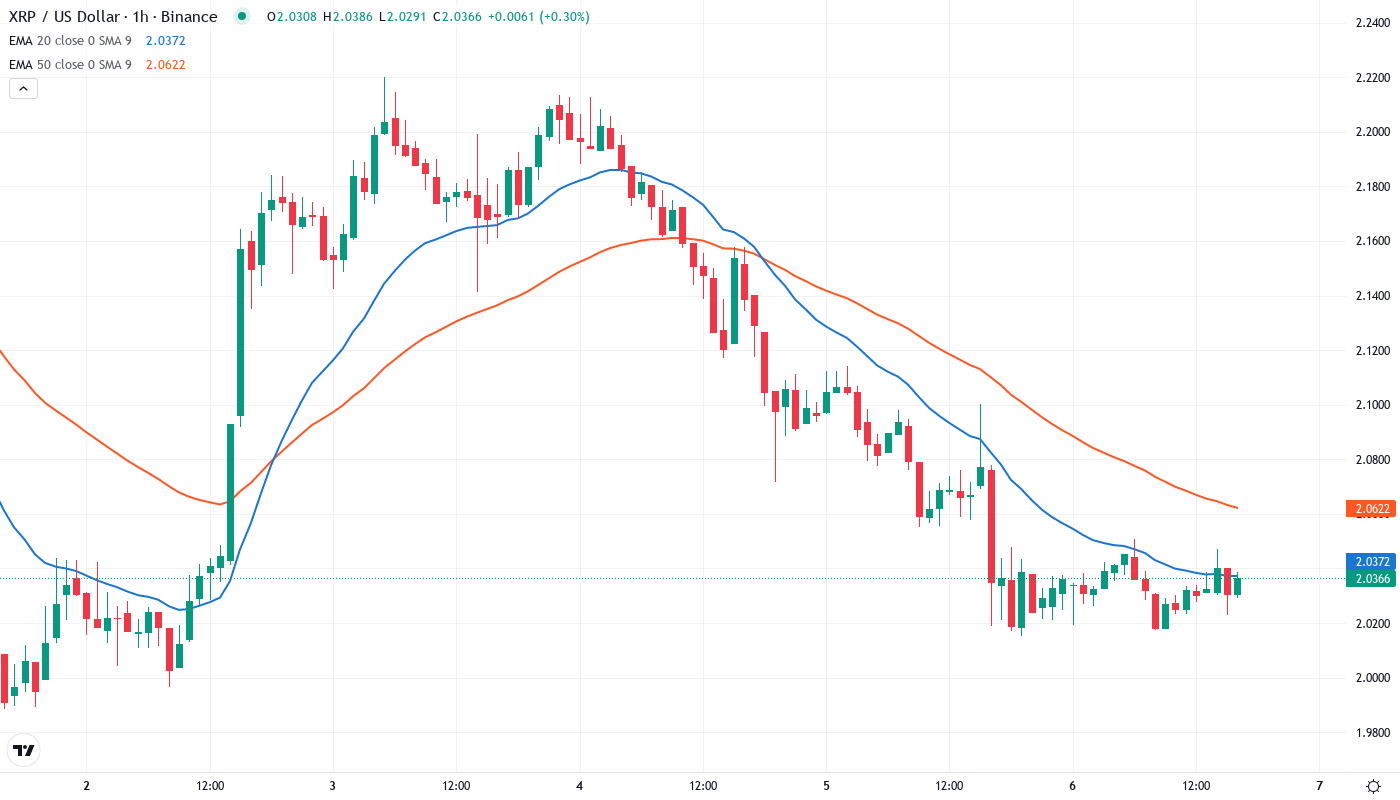
Price action tells a clear story through the EMA ribbons – XRP currently trades below all major moving averages after slicing through the 10-day ($2.11) and 20-day ($2.15) EMAs during last week’s breakdown. Each attempt to reclaim the 20-day EMA has been met with selling pressure, transforming this level from dynamic support into resistance that’s capped three separate recovery attempts. The 50-day EMA at $2.29 looms overhead as the next major hurdle, representing both the pre-breakdown support and the level where December’s rally accelerated.
More telling is the compression between the 10-day and 20-day EMAs, now separated by just $0.04 – the tightest reading since November’s consolidation that preceded the explosive move toward $2.58. Historical patterns show such MA compressions often resolve with 15-20% directional moves, with the first EMA reclaimed typically determining direction. The powerful technical indicator mentioned in recent analysis likely refers to this compression setup, as similar configurations have preceded XRP’s strongest rallies when combined with oversold momentum readings.
Resistance Stacks Between $2.15-$2.29 While $1.72 Support Faces Seventh Test
Above current price, sellers have fortified a resistance zone between the 20-day EMA at $2.15 and the 50-day EMA at $2.29, with the monthly pivot at $2.19 adding another layer of overhead supply. This $0.14 range represents roughly 7% of potential upside before hitting major resistance, making it a natural target zone for any relief bounce. The December breakdown level at $2.31 serves as the ultimate bull/bear line – any daily close above this transforms the entire structure back to bullish.
Bulls now guard the $1.72 support level that’s proven reliable through six separate tests dating back to June, with each bounce accompanied by increasing volume that suggests accumulation. The weekly pivot at $1.79 provides intermediate support, but it’s that $1.72 level that represents the true line in the sand – a breakdown here would expose the August lows near $1.43 and potentially trigger another 20% decline. It is worth mentioning that institutions’ 473M token accumulation clustered around the $1.80-$2.00 zone, creating a natural demand pocket.
Crucially, the market structure shows a potential inverse head and shoulders pattern forming on the daily timeframe, with the neckline at $2.15 aligning perfectly with EMA resistance. Should price reclaim and hold above this level, the measured move targets $2.58 – precisely the December high that started this correction. The pattern gains validity from the volume profile showing accumulation during the recent “right shoulder” formation between $1.95-$2.05.
Bulls Must Reclaim $2.15 to Shift Momentum as ETF Flows Accelerate
Bulls require a decisive daily close above the 20-day EMA at $2.15 to confirm the correction has ended and open a path toward testing $2.29 resistance. Such a move would complete the inverse head and shoulders pattern while flipping short-term momentum indicators bullish – especially if accompanied by ADX climbing above 25. The $1B AUM milestone for XRP ETFs provides the fundamental catalyst for sustained buying pressure once technical conditions align.
The bearish scenario triggers if XRP fails to hold the $1.72 support on its seventh test, particularly on heavy volume that would signal capitulation. A breakdown below this multi-month support would likely flush positions down to $1.43, representing another 30% decline from current levels and erasing all gains since October. This would trap recent ETF buyers who entered during the December rally, potentially creating tax-loss selling pressure.
Given the technical reset in momentum indicators, institutional accumulation at current levels, and upcoming Smart Escrow implementation, the most probable near-term path sees XRP consolidating between $1.95-$2.15 while building energy for the next directional move. The convergence of MA compression, oversold bounce potential, and fundamental catalysts suggests any break above $2.15 could spark a sharp recovery toward $2.50, making current levels attractive for patient buyers willing to use $1.72 as their stop-loss level.