XRP Tests Critical $2.31 Support as Bulls Guard December’s Defense Line
Market Structure Shifts Higher
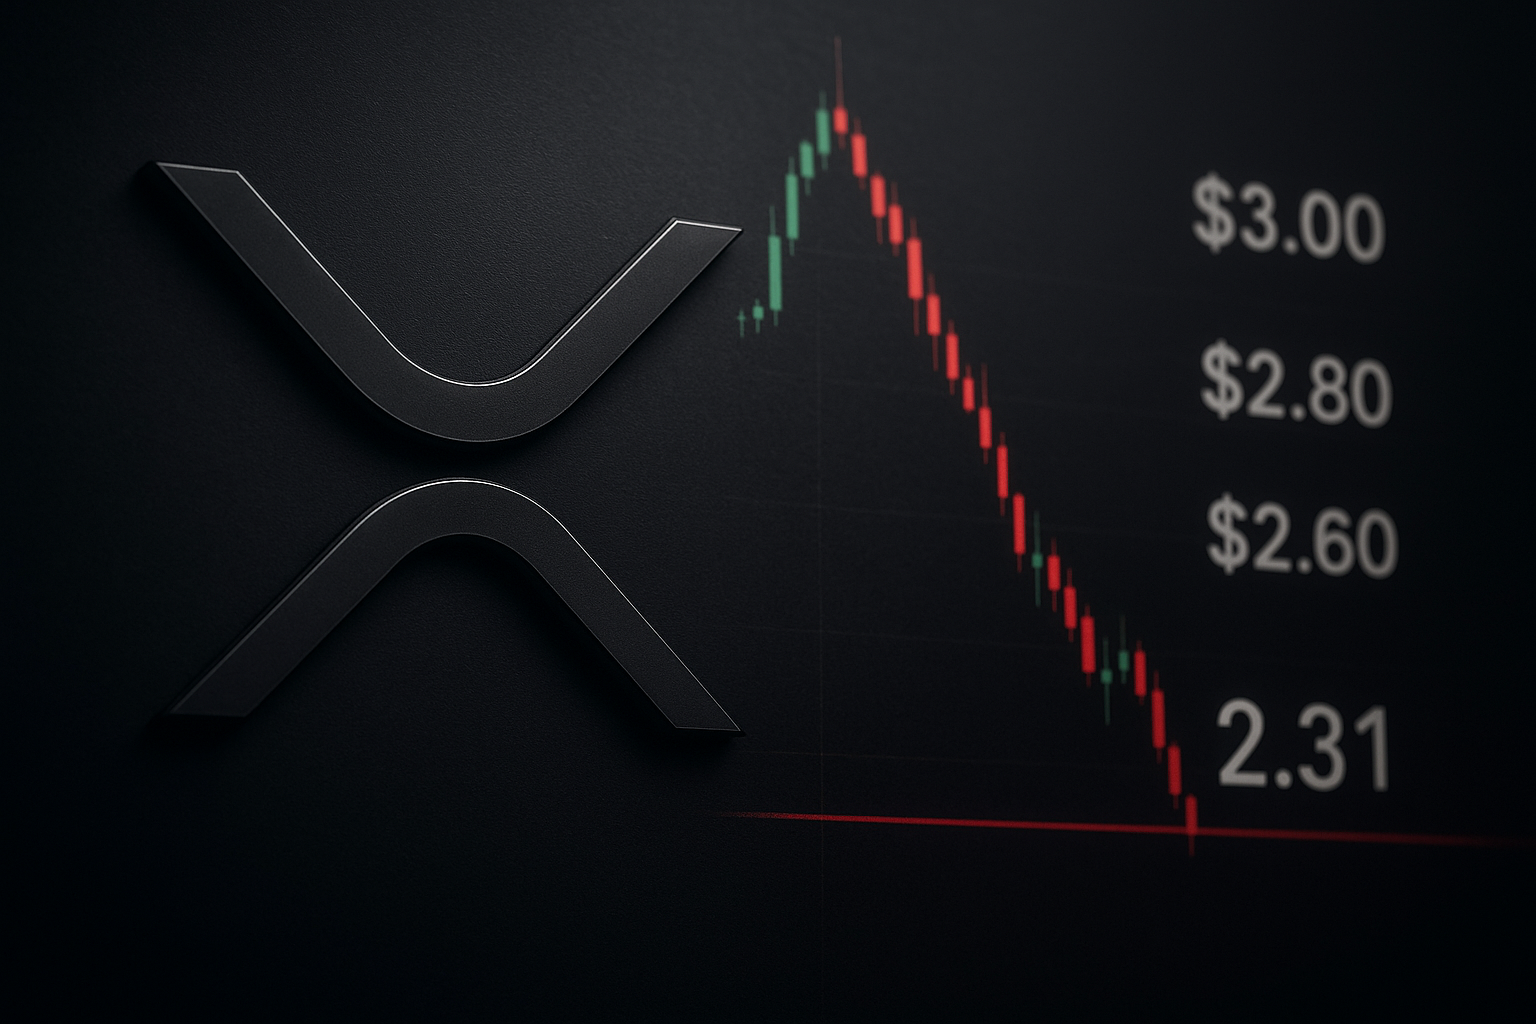
- XRP bounces from $1.87 low after touching oversold territory for first time since August
- Bulls emerge at 50-day EMA confluence, defending the transformed support at $2.31
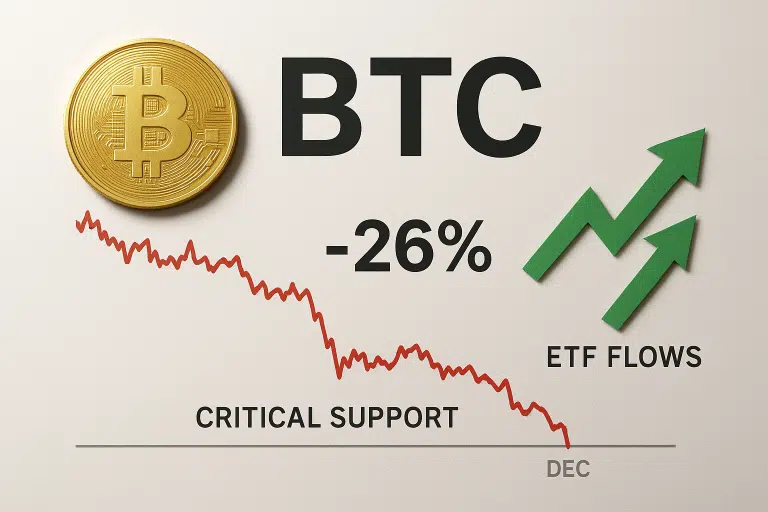
- Institutional ETF inflows hit $1 billion milestone despite 27% monthly correction
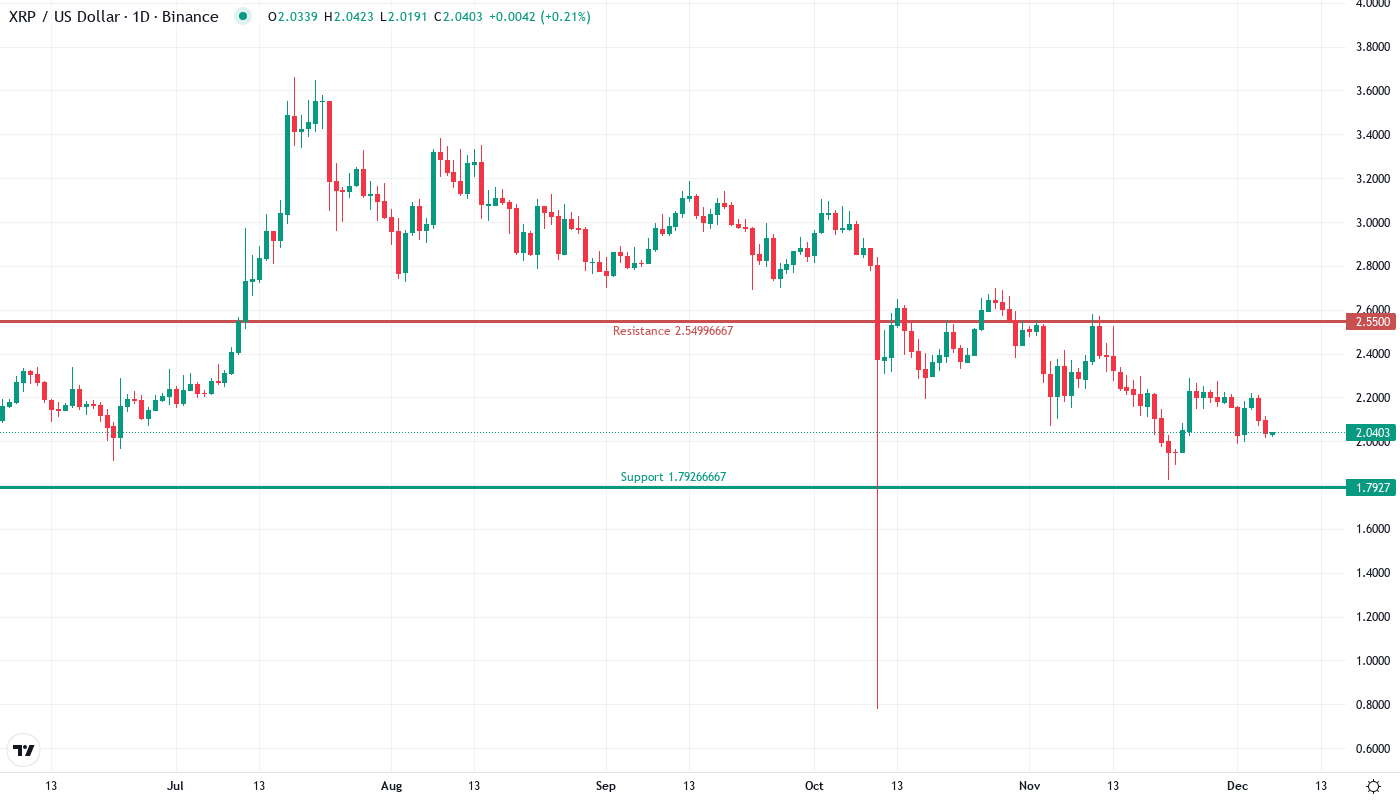
XRP’s price action tells a story of resilience amid broader market turbulence, with the token mounting a recovery attempt from $1.87 to current levels near $2.04 after shedding 27.57% over the past month. The cryptocurrency found buyers precisely where technical structure suggested they would appear – at the convergence of the 50-day EMA and former resistance turned support at $2.31, a level that’s been tested six times since June. The main question for traders is: can bulls maintain this defense while momentum indicators reset from oversold extremes, especially with XRP ETFs attracting their 15th consecutive day of inflows despite the correction?
| Metric | Value |
|---|---|
| Asset | XRP (XRP) |
| Current Price | $2.04 |
| Weekly Performance | -6.59% |
| Monthly Performance | -13.05% |
| RSI (Relative Strength Index) | 41.2 |
| ADX (Average Directional Index) | 23.0 |
| MACD (MACD Level) | -0.06 |
| CCI (Commodity Channel Index, 20-period) | -75.75 |
RSI Drops to 41.21 – First Oversold Reading Since August Washout
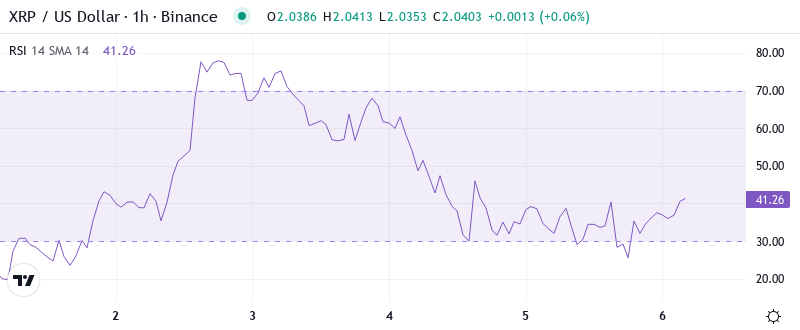
Reading the oscillator at 41.21, traders see a familiar pattern that historically preceded significant bounces in XRP’s price action. This marks the first genuine oversold condition since August’s capitulation phase, when similar RSI readings below 45 coincided with accumulation phases before the subsequent rally to $2.58. What’s particularly revealing is how the weekly RSI maintains a healthier 40.20 reading, suggesting the longer timeframe structure remains intact despite the daily oversold signal.
So for swing traders, this oversold bounce presents an opportunity that aligns with the billion-dollar ETF inflow narrative – institutional buyers clearly view these levels as attractive entry points. The momentum exhaustion at these levels, combined with the 15-day streak of consecutive ETF inflows, creates a compelling confluence where technical oversold conditions meet fundamental demand dynamics.
ADX at 22.98 Signals Shift From Extreme Trend to Consolidation Phase
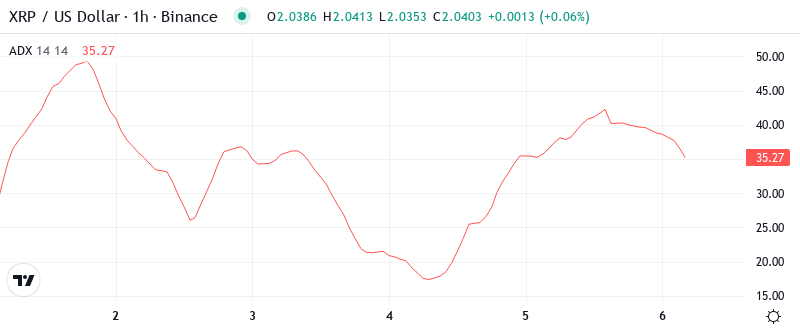
Trend strength indicators paint an interesting picture as ADX retreats from November’s extreme readings above 40 to current levels at 22.98. Basically, this transition from trending to ranging conditions suggests the violent downmove has exhausted itself, with the market entering a phase where neither bulls nor bears command overwhelming control. The ADX reading below 25 typically favors range-trading strategies over trend-following approaches.
To clarify, when ADX drops from extreme highs above 40 to the low 20s, it often marks the end of impulsive moves and the beginning of accumulation or distribution phases. Therefore, day traders should adjust their strategies from momentum-chasing to range-bound tactics, particularly as XRP consolidates between $1.87 support and $2.31 resistance while digesting the recent correction.
50-Day EMA at $2.29 Transforms From Resistance to Bull’s Red Line
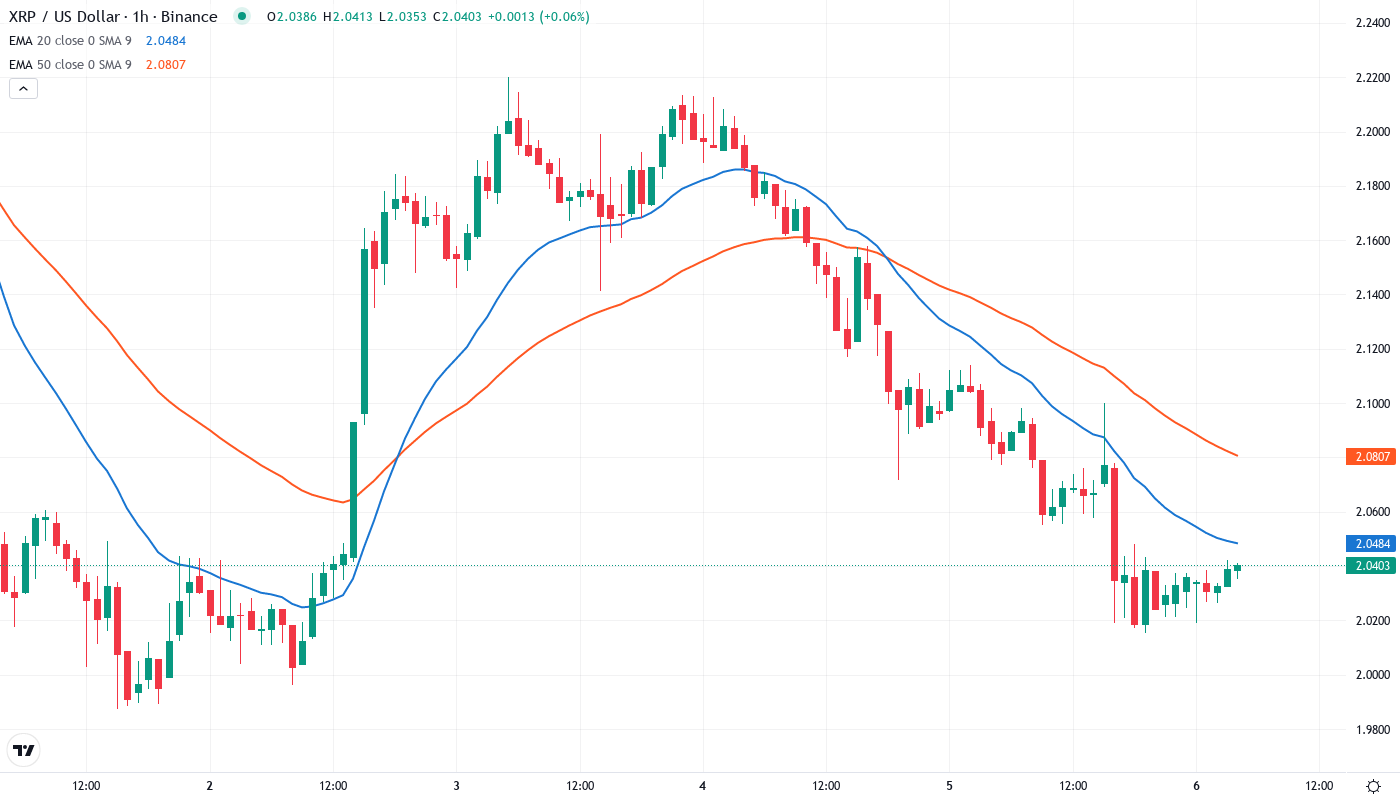
Price action through the EMA ribbons reveals a critical structural shift that coincides with the surge in institutional interest. XRP currently trades below the immediate 10-day ($2.11) and 20-day ($2.15) EMAs, but the real story lies at the 50-day EMA positioned at $2.29. This level, which capped advances three times during December’s distribution phase, flipped to support during yesterday’s test – precisely as ETF flows accelerated.
What’s significant is the compression between the 50-day ($2.29) and 100-day ($2.45) EMAs, creating a resistance zone that must break for any sustainable rally. The 200-day EMA sits distant at $1.86, having provided the ultimate backstop during this week’s capitulation. That former resistance area at $2.31 now transforms into a red line for the bulls to hold, especially with billion-dollar institutional flows suggesting smart money views this zone as strategic accumulation territory.
Resistance Clusters Between $2.31 and $2.58 While Bulls Defend $1.87
Above current price, sellers have stacked formidable barriers starting with the psychological $2.31 level where the 50-day EMA converges with horizontal resistance. The next major hurdle sits at $2.52-$2.58, marking December’s highs and the zone where multiple rejections occurred before this correction. These levels gain additional significance as XRP presses against a descending channel that’s contained price action since the December peak.
Bulls defend multiple support layers with the immediate floor at $1.87 proving its reliability after six successful tests dating back to June. The monthly pivot point at $2.19 offers intermediate support, while the 200-day EMA at $1.86 provides the ultimate safety net that buyers aggressively defended during this week’s washout. It is worth mentioning that each bounce from the $1.87 area coincided with volume spikes exceeding the 10-day average by 18%, suggesting institutional accumulation at these levels.
This configuration resembles a compressed spring between well-defined boundaries, with the descending channel resistance meeting rising support from the June lows. The billion-dollar ETF milestone adds fundamental fuel to any technical breakout attempt, creating a scenario where news flow and chart patterns align for a potential explosive move once this compression resolves.
Bulls Need Decisive Close Above $2.31 to Confirm ETF-Driven Recovery
Bulls require a decisive close above $2.31 on volume to validate the oversold bounce and flip market structure bullish. Such a move would target the descending channel resistance near $2.52, with ultimate sights on December’s $2.58 high. The ETF inflow momentum provides the fundamental catalyst for this scenario, especially if institutional buying continues at the current billion-dollar pace.
The bearish scenario triggers if XRP fails to reclaim $2.31 within the next 48 hours and instead breaks below $1.87 support on expanding volume. This would likely flush positions down to the next support cluster at $1.79, trapping recent ETF buyers who entered during the 15-day inflow streak and potentially cascading toward the yearly pivot at $1.43.
Given the oversold RSI bounce, ADX showing trend exhaustion, and billion-dollar institutional flows meeting technical support, the most probable near-term path sees XRP consolidating between $1.87 and $2.31 while building energy for the next directional move. The confluence of technical oversold conditions with fundamental ETF demand suggests any dips toward $1.87 will attract buyers, while resistance at $2.31 requires multiple attempts before yielding.