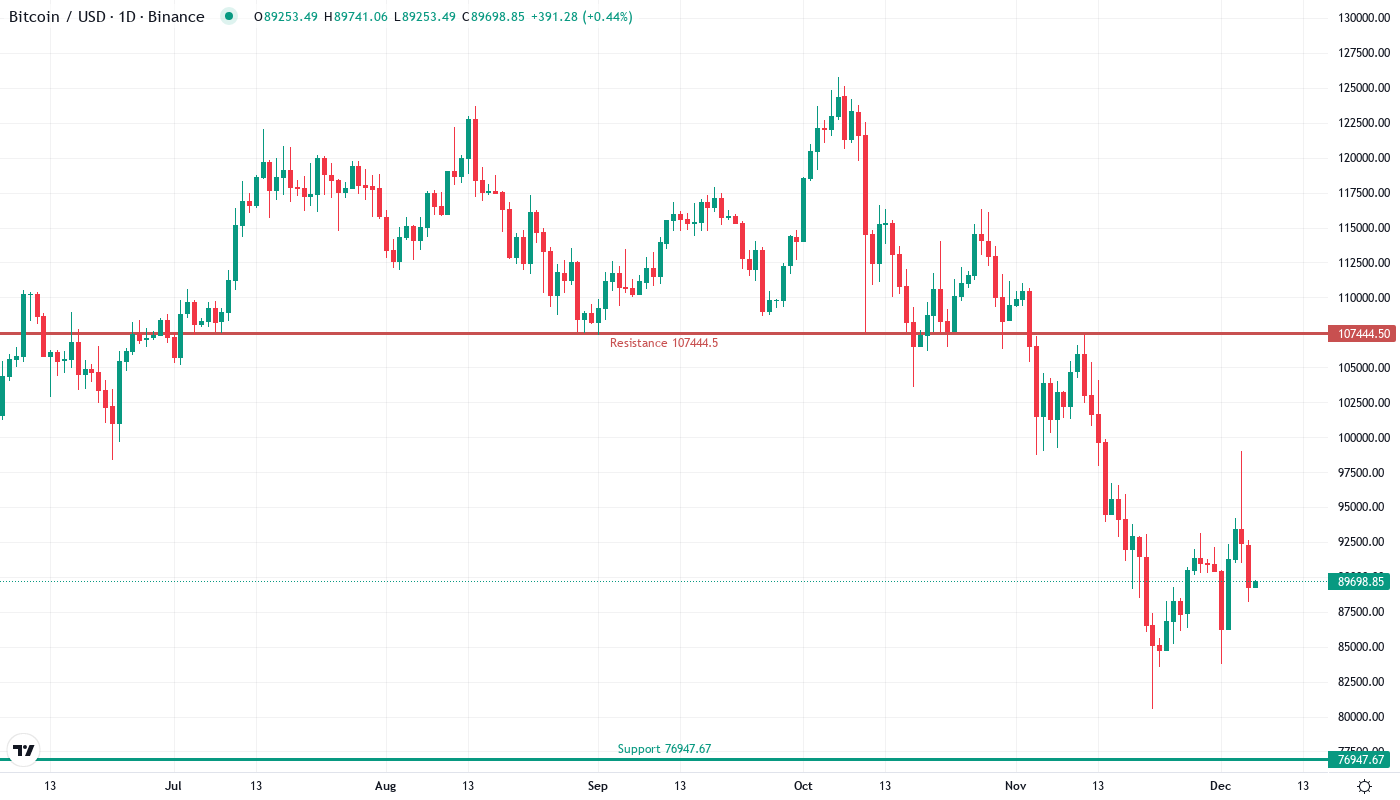
Bitcoin Tests $90K Support After BOJ Rate Hike Triggers 13.65% Monthly Slide

Market Pulse
- Bitcoin is trading at $89,700 after the Bank of Japan’s rate announcement led to a risk-off climate in the crypto market
- Despite six days of bearish trading, the important $88,256 (50-day EMA) support level remains intact
- The launch of CFTC-regulated spot trading is establishing an institutional foundation, while short-term technicals look weak
Bitcoin’s volatility has been immense compared to traditional markets, and equities have their own problems at the moment, largely due to central banks draining enormous amounts of liquidity from the system in fear of inflation running rampant. That will eventually be good for Bitcoin, but in the short term, the margin debt that we have witnessed begin to come off could continue to send “shockwaves” through many markets as liquidity dries up.
| Metric | Value |
|---|---|
| Asset | BITCOIN (BTC) |
| Current Price | $89700.60 |
| Weekly Performance | -1.38% |
| Monthly Performance | -13.65% |
| RSI (Relative Strength Index) | 42.9 |
| ADX (Average Directional Index) | 31.6 |
| MACD (MACD Level) | -2408.05 |
| CCI (Commodity Channel Index, 20-period) | -1.02 |
Momentum Exhaustion Signals Capitulation Phase – RSI Hits 42.94
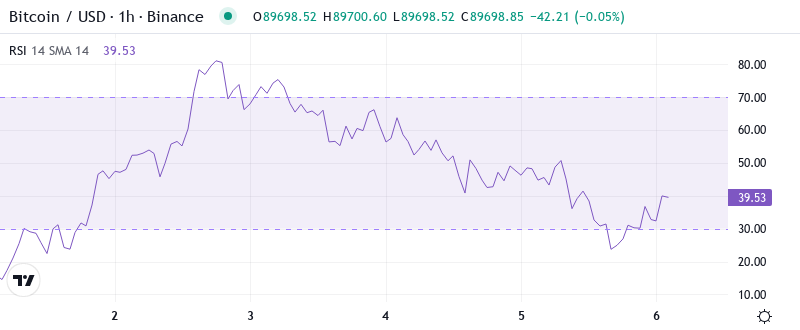
The daily MACD flipped bearish for the first time since early November, while the RSI also dropped below its midline to 43 in a sign of weakening positive momentum. This comes after a triple bearish divergence on the January 3 peak, which is about as potent a sell-signal as you can get, warning that the buyers are literally exhausting themselves.
Based on history, similar RSI configurations in September have sometimes been local bottoms with RSI around 41-43, while at other times they’ve been a way-point to further oversold conditions with RSI reaching 30. For swing traders therefore, this balanced-yet-weak RSI means waiting for a confirmed bounce above 50 or preparing for potential entries if we reach true oversold conditions below 30. Spot trading under CFTC rules and regulations may provide that fundamental pivot into a more positive FRM environment, but we must wait for the technicals to confirm the narrative shift.
ADX at 31.64 Confirms Mature Downtrend Gaining Steam
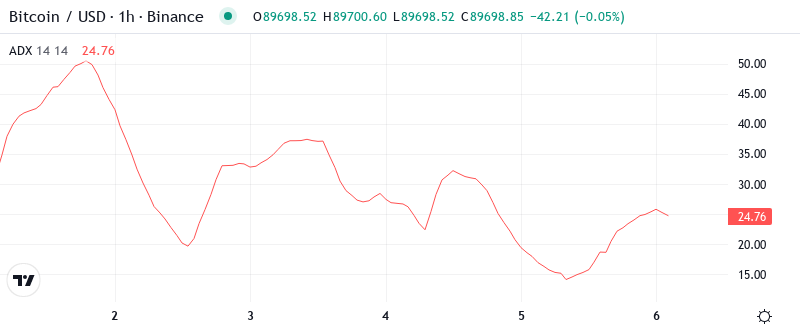
With the ADX (average directional movement index) at 31.64, we have a clear-cut trending move as opposed to choppy consolidation. The ADX crossed above 25 just as the BOJ news came out and has been steadily rising since – meaning that this is not just a random throw of the dice, the sellers actually have conviction behind this move. Put differently, we have shifted from the ‘sideways grind’ that characterised early January to a ‘straight kinda’ market where trend following strategies go to work.
In simpler terms, the ADX is showing that large investors are slowly selling off their crypto holdings, and this could be related to upcoming Federal Reserve announcements. In this situation, day traders are advised to take a different approach and bet against any short-term increases in the market instead of buying when it dips. This should continue until the ADX indicator decreases or the prices go above specific resistance levels.
50-Day EMA at $88,256 Becomes Final Line of Defense
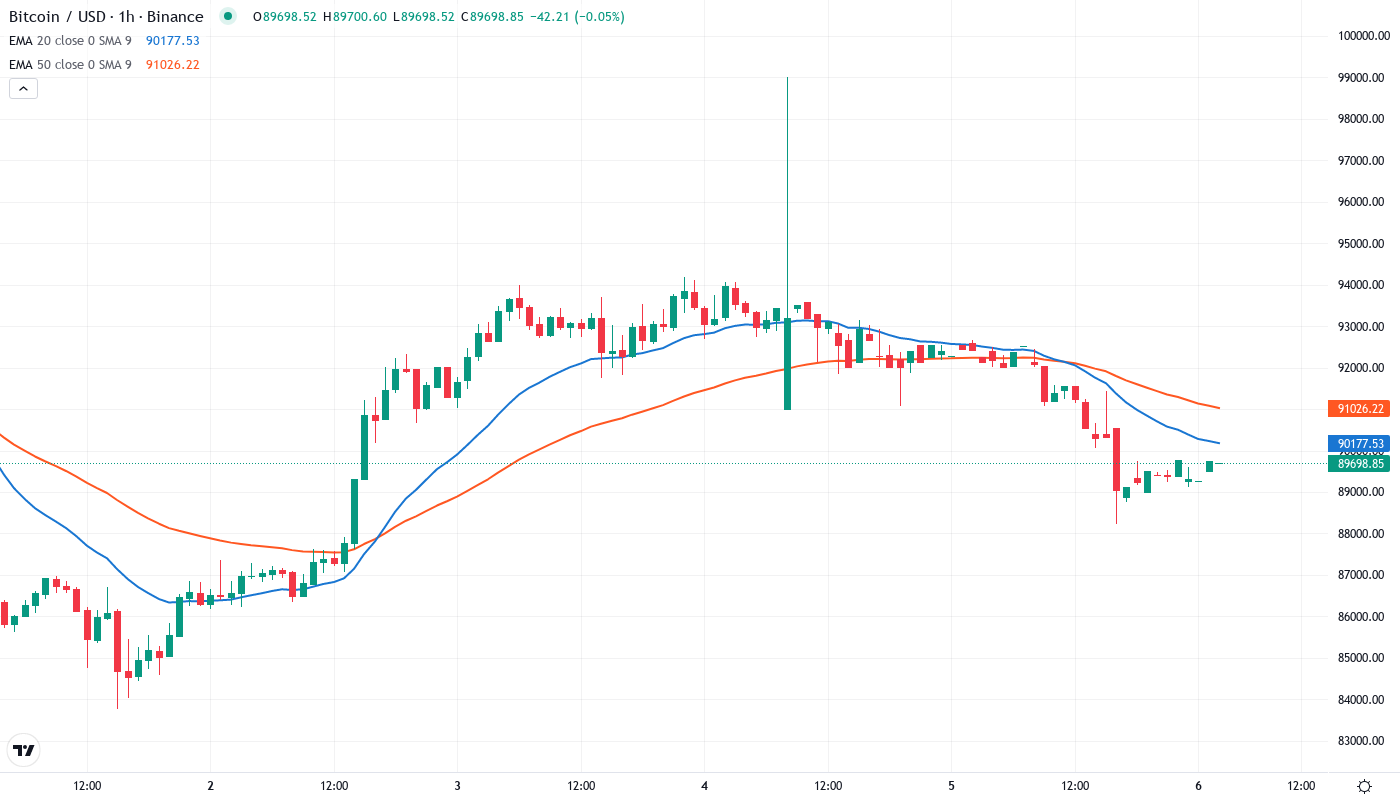
Looking at the volume profile visible range from the $58,845 range low, we can see a high volume node at $90,500 and a second high volume node from $88,350-$88,850. This makes the area between the two 50 and 10 EMAs a logical retest if the 50-day fails to hold as support. A break below the node from $88,350-$88,850 becomes a high likelihood if the 50-day gives way. Buyers will look to step in at the $85,250-$86,250 range before it becomes the next downside target. Remember, the downtrend is guilty until proven innocent.
The support level that used to be at $91,711 has now flipped to become a stiff resistance, which the bulls need to overcome to change the tide. In the meantime, the 50-day EMA level of $88,256 is the last support standing before falling into a void down to the 100-day EMA at $85,573. The 50-day and the 100-day are contracting together, like a spring and the ADX indicator also shows momentum of the current trend. Hence, the southward looks easier unless buying interest near the 50-day EMA is strong enough to cushion the fall.
Support Architecture Weakens as $90K Psychological Level Cracks
There is strong resistance in the vicinity of the monthly pivot at $93,983 and the 20-day EMA at $91,711, which December’s volume profile highlights as a point of heavy distribution. This was fiercely retested as resistance by sellers during yesterday’s rally, which further reinforces this level as a strong resistance zone. The weekly R1 at $107,444 might be out of reach based on the current picture.
Currently the price is back at the 50-period moving average on the 4h chart and will likely find some support here which could lead to a small bounce but we should see the price returning to the $81,000 area soon. The $81,000 has been heavily tested in the past few days if that level gives way I think we could see the price of Bitcoin dropping to the $77,000 area.
Importantly, the market structure changed significantly to the downside after the price dropped below the monthly pivot point of $93,983, backed by high trading volume. Although the CFTC spot trading debut helped maintain the price around those levels, the situation looks unfavorable from a technical standpoint. Bulls must demonstrate their strength by pushing the price back above $91,711 and maintaining this level for at least one daily closing. Otherwise, the bearish scenario becomes more likely as unsuccessful tries increase.
Bears Target $80K Unless Bulls Reclaim $91,711 Resistance
Buyers need to push the price decisively above the 20-day EMA at $91,711 to eradicate the bearish bias, with the first upside target at the monthly pivot around $93,983. The regulated environment along with possible institutional buying interest around these levels could be sufficient catalysts, especially if the overall risk environment settles down after the BOJ surprise.
If we lose the 50-EMA on the 4-day chart, the 200-daily MA at $79,000 is likely the goal. This means hedge bids around there could be a prudent strategy—risking a possible stop-run reversal down to $74,000 (though it’s more likely $76,000).
Based on the technical setup and macro headwinds created by increasing global rates, the most likely short-term scenario is for Bitcoin to consolidate between $88,256 and $91,711 before making its next move. That said, RSI has room before becoming oversold, and ADX has shown strength in confirming the trend, so the risks are tilted to the downside for now.