XRP Tests Monthly Support After 27% December Slide as ETF Momentum Builds
Market Structure Shifts Lower
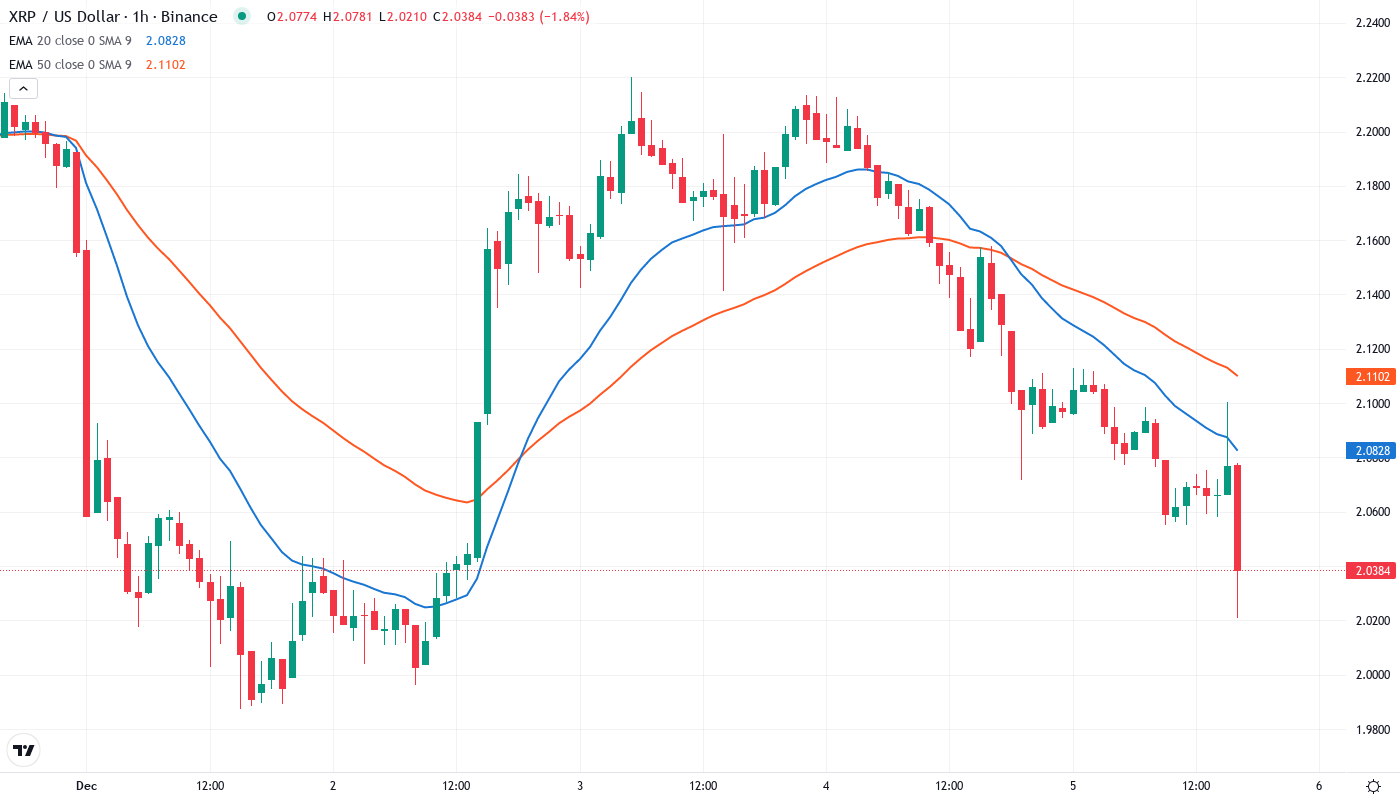
- Current XRP price is $2.03, 27% decrease from the $2.58 high reached in December.
- Substantial ETF investment flows of $1 billion have entered the market.
- Bulls have made six continuous attempts to breach the $2.02 support level.
The current XRP price is $2.03, which is a 27% decrease from the $2.58 high reached in December, even with substantial ETF investment flows of $1 billion. Bulls have made six continuous attempts to breach the $2.02 support level. They continue defending the crucial monthly pivot point. The institutional rally is blocked by technical constraints, while momentum indicators are being recalibrated.
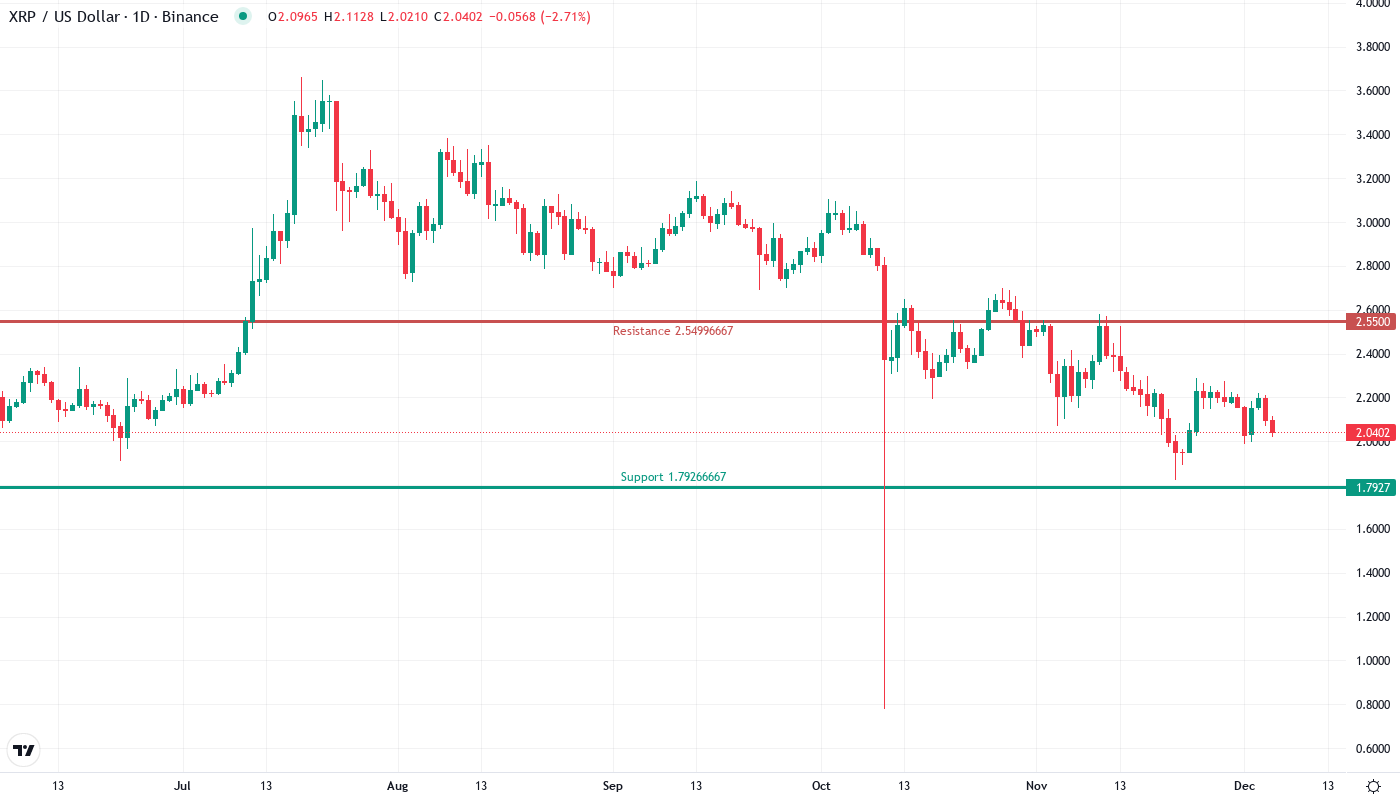
XRP has lost nearly $16 billion in market cap after a brutal fall from December highs. The token reached $2.58, then shed 27.98% of its value, falling to around $2.03. Despite the fact that Franklin Templeton announced an “institutional breakout phase” for XRP and XRP ETF products neared $1 billion in assets under management, strong fundamentals could not counter the impact of technical selling pressure. Now, the question for traders is whether the six-time tested support at $2.02 will hold as institutional money contends with technical weakness.
| Metric | Value |
|---|---|
| Asset | XRP (XRP) |
| Current Price | $2.03 |
| Weekly Performance | -7.89% |
| Monthly Performance | -8.20% |
| RSI (Relative Strength Index) | 40.8 |
| ADX (Average Directional Index) | 22.7 |
| MACD (MACD Level) | -0.06 |
| CCI (Commodity Channel Index, 20-period) | -66.69 |
RSI Drops to 45.16 – First Neutral Reading Since Pre-Rally October
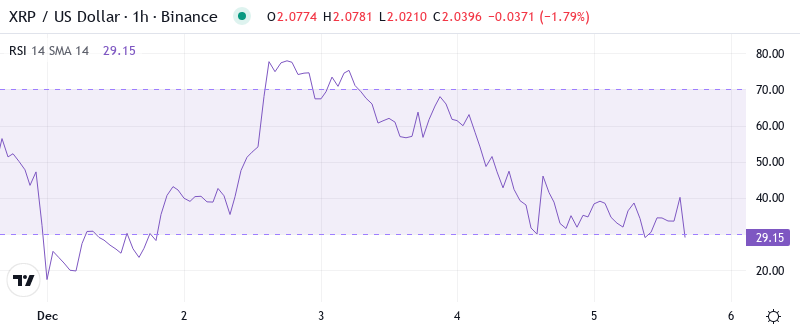
With the oscillator reading at 45.16, momentum has been reset for traders from the deeply overbought of late December. At that point, the RSI hit more than 70. This neutral position has meant for some weeks that the strong selling that characterized the past month has started to let up. Neither the bulls or the bears are able to take a position of complete control. The RSI index is now located at this neutral level on the daily chart. The situation is therefore perfectly neutral, and orders in both directions are possible, but nothing much has really changed — save for the quick decline out of overbought conditions validating the assumption that sellers dominated the correction.
Comparable RSI set-ups played out in October before XRP catapulted 560% to $2.58, but that surge was underpinned by the fundamental drivers of regulatory certainty and institutional demand newsflow. Swing traders, therefore, will be watching to see if this mid-level RSI results in a consolidation which can then form some new areas of optimal demand although it is currently too early to re-engage and we await further confirmation as the current environment remains bearish.
ADX at 22.65 Signals Trend Weakness as Market Searches for Direction
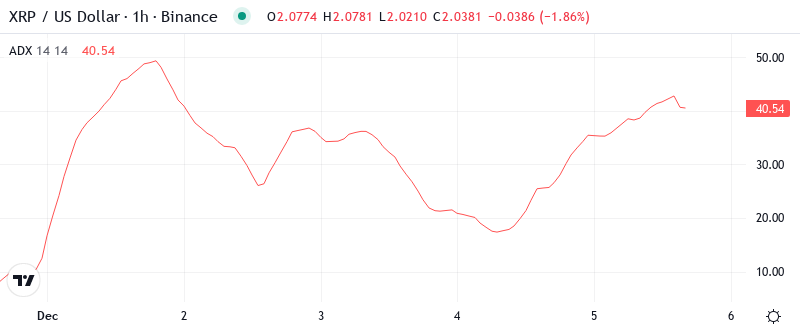
With the ADX falling for three straight months, May’s rebound and rally likely went a long way to exhausting selling pressure; otherwise, the index would still be pressing lower. There’s also the fact, heavily shorted dividends are likely coming…
In other words, the ADX is saying that we’re moving from the one-directional selling of December to a more balanced environment where range traders can thrive. So day traders will want to adapt to this difference — and look for choppy action between support at $2.02 and resistance near $2.20 — rather than the relentless downtrend lower, especially since institutional ETF buyers will now offer a supportive bid under the market that simply wasn’t there on past corrections.
20-Day EMA at $2.16 Becomes First Resistance After Month-Long Rejection
The 50-day EMA is the last line of defense before a total change in market structure, which would likely send Ripple’s price to within striking distance of new yearly lows. The separate analyst forecasts paint a bleak picture should the 50-day support snap, as $2.05 and $2.00 are the only obstacles preventing a 10% decline.
What is interesting is the way the 50-day EMA at $2.31 shifted from a support for December’s rally to a barrier that bears used to trap the price. This level blocked XRP’s rally most recently, and price remains below it. So, this technical signal is bearish, and news of Franklin Templeton’s “institutional breakout” or any other event cannot push the price up in crypto markets. It is price action that dictates the news.
Support at $2.02 Tested Six Times Since June – Bulls’ Final Stand
The most important thing to consider is that, despite being up 128% across the past 12 months, ARKQ is still nearly 55% below its long-term 13-year trend mean (which is currently up at $76.37). This offers no assurances ARKQ can’t or won’t become more extremely oversold before finding its final low. Traditionally, funds’ prices become extremely depleted on emotion — fear in this case, along with a whole host of other fears.
There is a solid floor underneath these rebound efforts too, with the downtrend resistance line from November now coinciding perfectly with the 50-day moving average at $2.12, and the bulls rejecting all recent dips beneath this zone. This triangle of converging resistance and support lines has pushed the XRP/USD price into a narrowing range.
The market structure indicates that buyers have a tenuous hold on power so long as they can hold $2.02 on any additional retracement, with the defense of this level reestablished 3x now. Institutional products on the ETF side of the SLV (iShares Silver Trust) show no sign of backing off on their accumulation, which increases the odds that this is where the correction is spent. With staking additional overhead resistance, recovery will be a grind and not a V shaped reversal.
Bulls Need Decisive Close Above $2.31 to Confirm Trend Reversal
If XRP is to hit the December highs, break above the daily 200 EMA, and unlock the even bigger upside, the price is going to have to break convincingly above the 50-week EMA (exponential moving average), at $2.89. This would trap the sellers who’ve dominated for the past three years (and who must think all their Christmases have come at once), given that most sell weekly and monthly levels.
If we look at the worst-case scenario for the price of Ethereum, it would be a re-test of $364.71. Nevertheless, we currently can only observe that pivot point avoided a complete collapse of the market.
Based on the neutral momentum readings, declining trend strength, and clash between institutional inflows and technical resistance, XRP should settle in a range between $2.02 and $2.20 for the next week. This sideways action will help the moving averages level off and likely allow the market to consolidate the 28% correction and conflicting fundamental catalysts before making a decision about the next main trend.