Dogecoin Tests Critical Support as ETF Speculation Meets Technical Exhaustion
Market Structure Shifts Lower
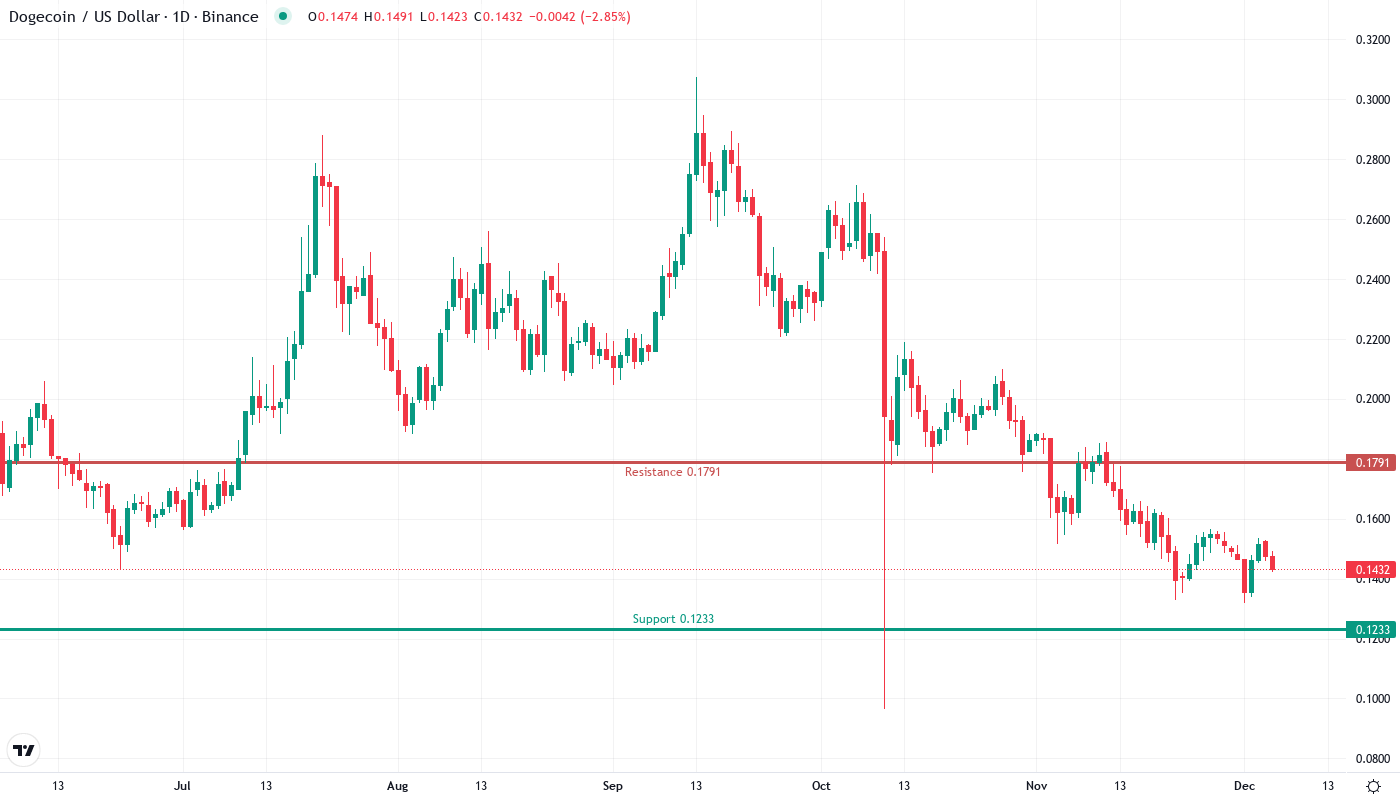
- DOGE trades at $0.1429, holding the $0.14 key support level after a rough week.
- Bounced at $0.123 support, delaying the downside target of $0.092 from the March 20 swing-high.
- Current CMC rank #18 with a live market cap of $18.89 billion and 24h volume of $1.16 billion.
DOGE is trading at $0.1429, holding the $0.14 key support level after a rough week. The downside target of $0.092 from the March 20 swing-high may not be reached yet after DOGE managed to bounce at the $0.123 support, which is now the level to hold moving forward.
The current price of Dogecoin (DOGE) is $0.1429, with a 24-hour trading volume of $1.16 billion. The current CoinMarketCap ranking is #18, with a live market cap of $18.89 billion. It has a circulating supply of 132.31 billion DOGE coins and a max. supply of ∞. If you would like to know where to buy Dogecoin, the top exchanges for trading in Dogecoin are currently Binance, Mandala Exchange, Huobi Global, ZBG, and OKEx.
| Metric | Value |
|---|---|
| Asset | DOGECOIN (DOGE) |
| Current Price | $0.14 |
| Weekly Performance | -6.30% |
| Monthly Performance | -12.17% |
| RSI (Relative Strength Index) | 40.6 |
| ADX (Average Directional Index) | 39.9 |
| MACD (MACD Level) | -0.01 |
| CCI (Commodity Channel Index, 20-period) | -60.93 |
RSI Drops to 40.61 – First Oversold Territory Since August Washout
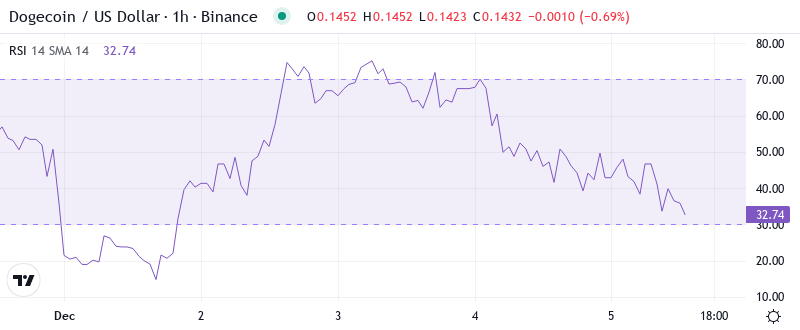
The Relative Strength Index stands at 40.61 on the daily chart, signaling Dogecoin’s first real oversold reading in four months. This level has produced relief bounces in August and October, with such rallies resulted in 20-30% rebounds over the following two weeks. The momentum exhaustion arrives just as ETF hype is reaching a fever pitch, highlighting an intriguing disconnect between sentiment and technicals.
What is interesting to note is that RSI has dropped during the decline in a straight line from 58.8 to current levels, without any divergence and support bounces. Hence, for swing trades, such a clean washout actually presents cleaner risk-reward than choppy declines: oversold bounces are more powerful if momentum indicators show no prior attempts of stabilization. The 21Shares filing couldn’t prevent the technical breakdown, but it may be the catalyst for oversold bounce, should buyers step in here.
ADX at 39.92 Confirms Mature Downtrend Nearing Exhaustion Point
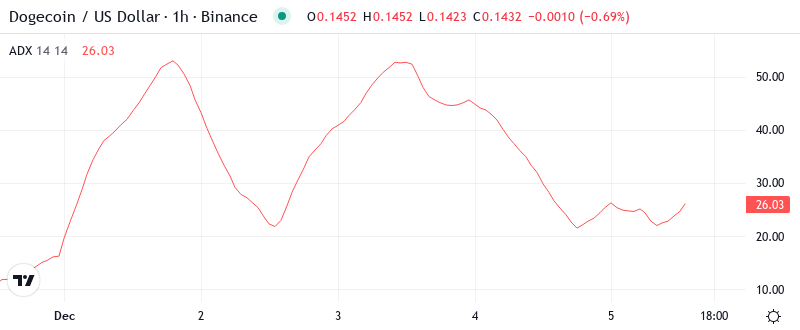
The trend strength indicators also indicate a dramatic narrative. With ADX rising to 39.92, this is the highest indicator since May collapsed. The ADX entry at this level indicates that, although the downtrend is powerful, it approaches historical reversal areas. Essentially, when the ADX exceeds 40 in crypto markets, it often indicates the depletion of the trend rather than the continuation.
When we look at earlier cycles, DOGE registered ADX readings above 38 at significant lows five of the past seven times since mid-2019. This doesn’t automatically spark a U-turn, but it does indicate that the path of least resistance to the downside could have already offered all the low-hanging fruit. Hence, day traders must be prepared for greater volatility and adjust their approach to play potential swings, as non-trending conditions frequently follow such extremes.
Moving Average Structure Completely Inverted – Bears Control All Timeframes
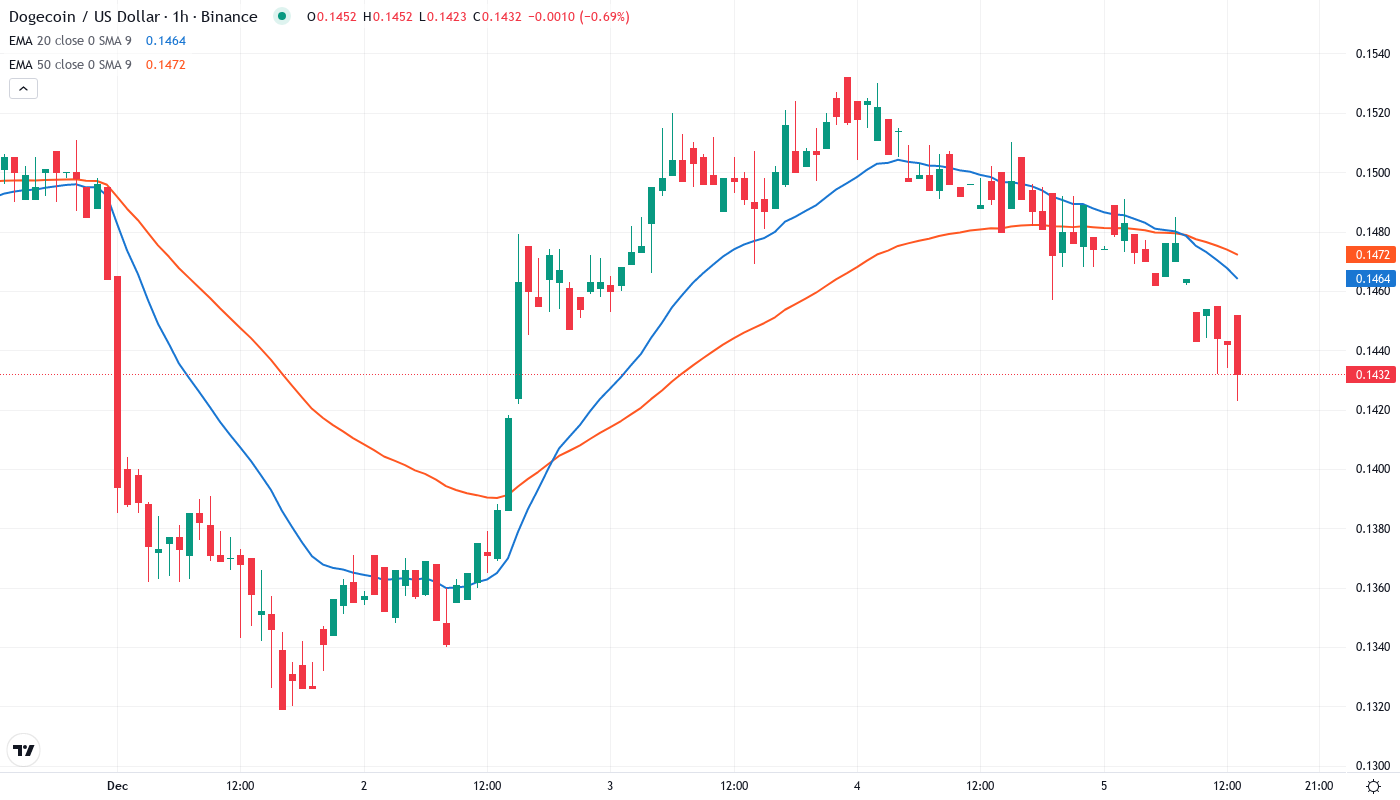
The EMA ribbons are widening (indicating increased volatility) and haven’t been this far spread since price squeezed above $0.30 in December. Navigating below the 100-day EMA leads to heaviness as stop-losses trigger and longs liquidate. Both of these factors reinforce negative momentum, forcing bear participants into the mindset of “selling rallies.”
The 50-day EMA stands at $0.1576, works as a strong barrier. In fact, it has turned down the departures on two occasions overnight in the last three meetings. Resistance turned into support, which is the positive side. The bulls will have to exceed this line to change the immediate downside trend. The benefit would cancel with a push above the 50-day EMA. The 10-day EMA stands less than a penny away from the 20-day EMA. This pattern is maturing and it depends on a break or even a breach of the 10-day EMA. Periodic selling for two days collapsed the cycle. A breakout type model will result in a sharp contraction. A large increase in volume was recorded during the session.
Support Architecture Crumbles Below $0.14 Psychological Level
There is now a significant amount of overhead resistance between the 50-day EMA at $0.181 and $0.196 (weekly resistance 2). The weekly RSI is looking to head back up but is in danger of printing new downtrend lows below 37. The MACD is trending back up and is threatening a bear cross.
Buyers are meanwhile scrambling to stave off further losses, but need to overcome a potential double-top formation on the hourly chart and the recent high at $0.166. The 4-hr 50-Moving Average is precariously close to dropping below the 200-MA. Furthermore, RSI and histograms on the daily and weekly show sustained selling momentum. Strategy would be to place low orders at $0.125 and raise them in 2-3% increments to $0.135 while monitoring Bitcoin’s price action.
Importantly, the market structure is similar to a descending triangle pattern with declining highs since December but steady support around $0.14. This consolidation often leads to a volatile break, and with the oversold reading and bullish fundamental developments, such as increased real-world use outside of Buenos Aires, the path of least resistance seems to the upside for bulls willing to wait it out vs bears pressing their luck.
Oversold Bounce to $0.156 Most Probable Before Trend Decision
Buyers will be stoked to see that the weekly 20-period EMA has continued to hold as resistance for DOGEBTC as per our previous analysis. In addition, the weekly Relative Strength Index (RSI) is back within the overbought territory after reaching down to oversold in January. This traditionally implies that technically overextended assets have returned to a more neutral RSI and thus could be prepared to run again. Finally, the Automotive Industry section of this week’s newsletter reinforces the current thematic tailwinds for everything DOGEUSD.
If the regulatory tide shifts in Ripple’s favor, either through legislative changes or the SEC’s approval of the ETF, then the $0.26 broken low from December could act as a support turned resistance level. The absence of a structural low makes $0.26 the most recent pivotal point, outside of the current range. New resistance should form a tumbling wall above $0.26 with prior peaks at $0.45, $0.53, and $0.57.
Based on the oversold technicals, mature downtrend exhaustion signals, and positive fundamental developments, the path of least resistance likely leads to a relief bounce and retest of $0.156 resistance before the market decides its next move. Ultra-low oscillator readings typically align with short- to medium-term pivot points yet the easiest path is still down until confidence-building resistance levels are reclaimed. The technical oversold conditions combined with growing real-world utility present an attractive opportunity for traders, but the larger downtrend claims tight risk management is critical until the 50-day EMA is recovered.