HBAR Tests Critical Support as Georgia Partnership Sparks Enterprise Adoption Wave
Market Structure Shifts Lower
- HBAR has dropped 18.7% in November and Georgia partnership news didn’t drive the price much at all.
- The Relative Strength Index is the indicator to watch for this trade, currently at 44.8 as it entrenches in a fresh neutral state after the recent 37.4 test.
- Buyers have tried to regain $0.107 support for the Token for two days with six successive monthly lows.
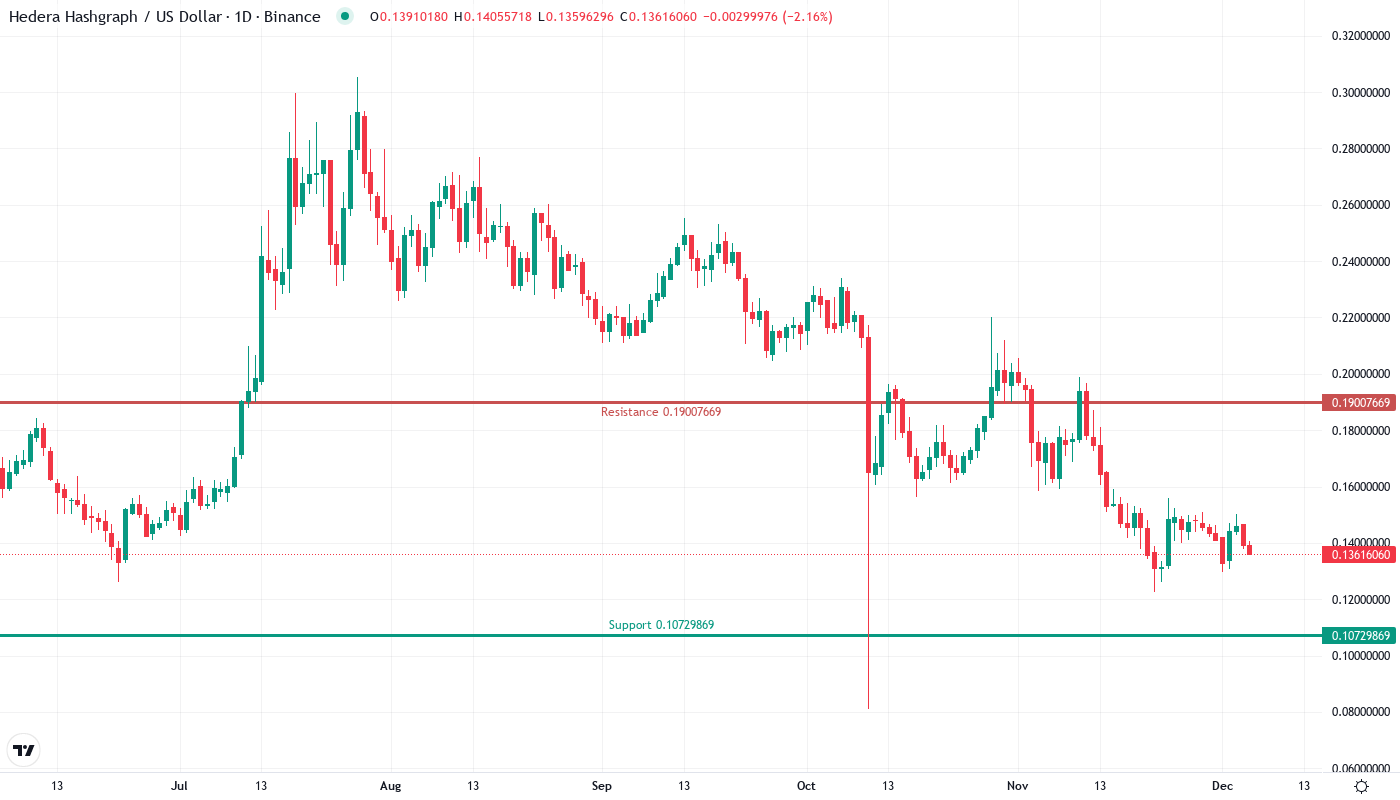
This week, HBAR slipped to $0.137, a month-long 18.7% decline, eliminating late-November gains. This painful decline occurred shortly after Georgia’s announcement that its entire national real estate registry would be transferred to Hedera’s network – major enterprise adoption news that would normally see prices surge. Now, with the token currently appealing to key support levels formed during November’s accumulation, the biggest question for traders is whether institutional adoption news can arrest the technical breakdown, or if sellers will be overcome all the same.
| Metric | Value |
|---|---|
| Asset | HEDERA (HBAR) |
| Current Price | $0.14 |
| Weekly Performance | -6.76% |
| Monthly Performance | -18.71% |
| RSI (Relative Strength Index) | 40.4 |
| ADX (Average Directional Index) | 19.8 |
| MACD (MACD Level) | -0.01 |
| CCI (Commodity Channel Index, 20-period) | -74.30 |
Momentum Resets to 44.8 After Testing Oversold Extremes
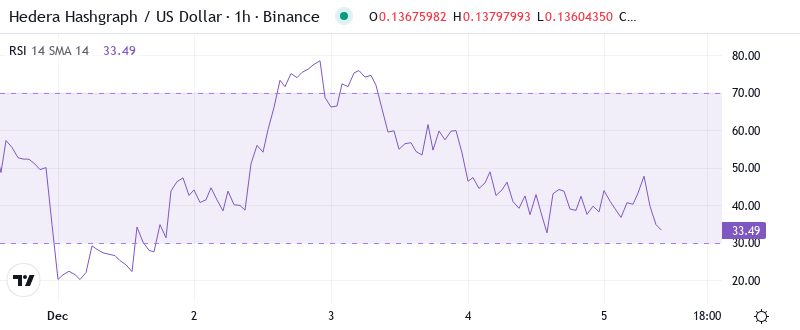
The RSI sits at 44.8 on the 1D, staging a sharp recovery from last week’s oversold dip to 37.4. This rebound after reaching deeply oversold levels replicates the setup from early November, where the RSI had similar readings prior to a 45% rally in three weeks. Notably, the oscillators price action indicates that sellers likely ran out of gas around the psychological $0.12 mark as that is where responsive buying came in, despite the overall weakness in the markets.
For swing traders, this momentum reset is a classic mean-reversion opportunity. The weekly RSI at 36.7 confirms overbought conditions on the higher time frames, while the monthly reading at 40 indicates we’re getting close to levels that have previously triggered major reversals. The real estate registry news out of Georgia likely wasn’t enough to avoid the sell-off to start the week, but it could be the kind of overarching fundamental catalyst needed to see momentum cross decisively bullish after other technical conditions are met.
ADX at 19.8 Keeps Range Traders in Control
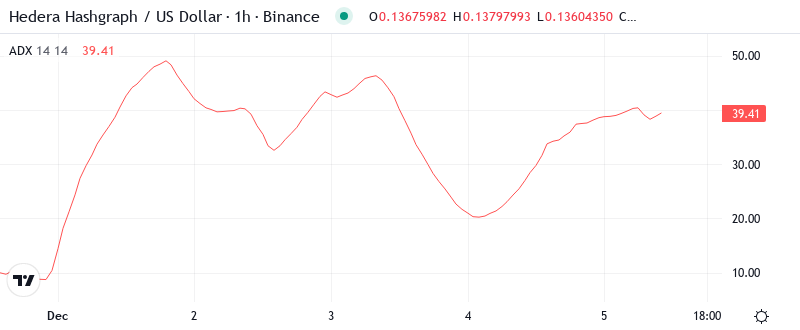
With the ADX under 15, it’s also not indicative enough for either side to seize control of the direction. Given recent history and overall conditions, the bias is to the downside, but any drop is likely to be contained at $0.10 and will pose yet another opportunity to buy the recent dip.
In simpler terms, the ADX suggests that we’re not yet in a phase where the price of the stock is consistently moving in one direction. This means that day traders should be cautious and consider trading against any sudden price movements instead of with them. While recent positive news and company developments have been promising, we haven’t seen a clear upward trend in the stock price. However, once the ADX indicates a stronger trend, we could see a significant increase or decrease in the stock price based on all the recent news and developments.
20-Day EMA at $0.146 Becomes First Resistance Target
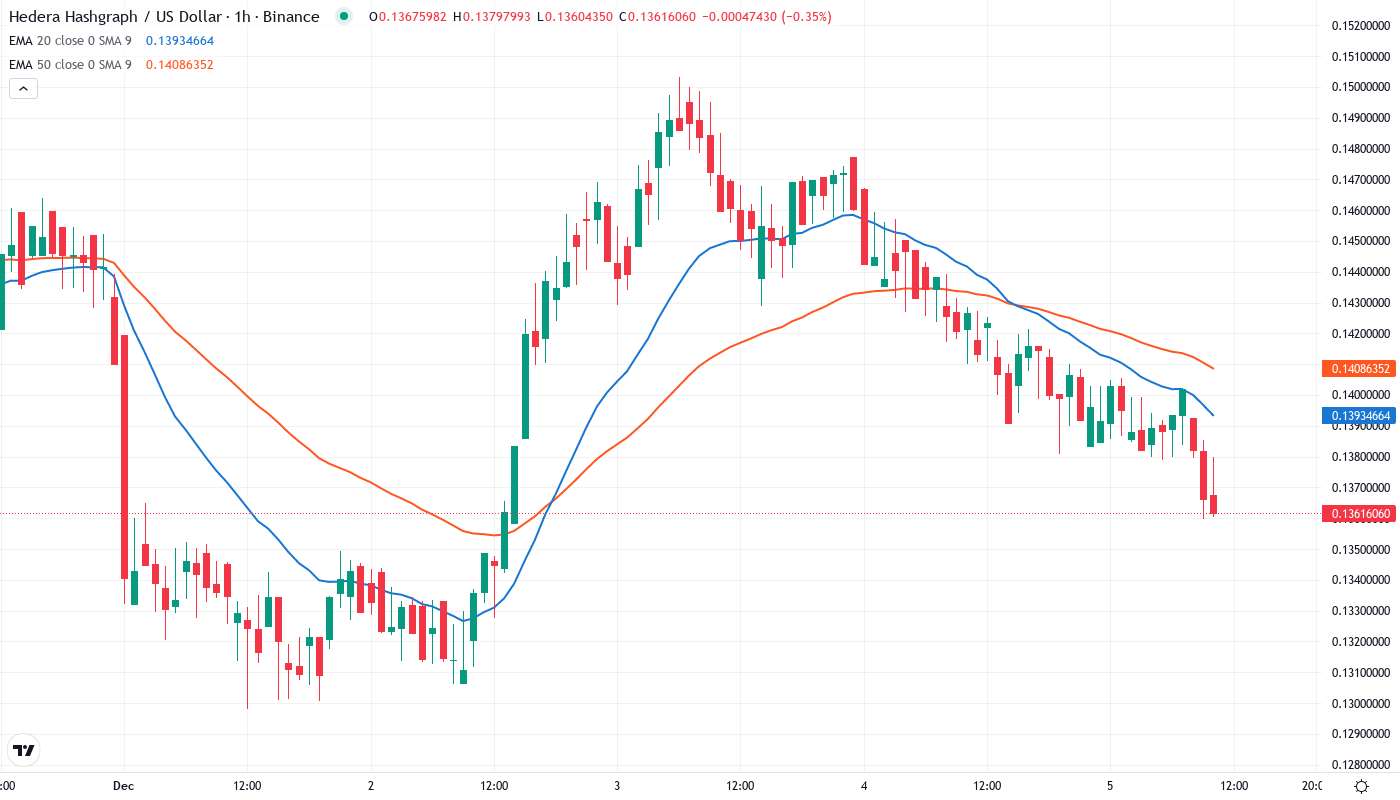
The 10-day EMA also cut beneath the 20-day EMA today, generating a bear cross on the daily chart. If the ribbons continue to fan apart in bearish fashion, their downward slope will accelerate this signal to the downside. Volume remains low after almost completely drying up during the rout, cautioning against taking the technical breakouts seriously. The 10-day EMA got captured as support twice early this month on what turned out to be fakeouts, however, a bullish divergence has since developed on the RSI that could likely prop this attempt.
The most important part is the compression that is occurring between the shorter-term averages. The 10-day and 20-day EMAs are meeting just about $0.145, giving us a critical zone for any sort of recovery to do so. Bulls will have to reclaim this cluster without a doubt to turn the market structure bullish. The increase in Hedera’s user base to 9 million and expansion within the real-world asset tokenization, obviously, are fundamental tailwinds, but we first need to see the price action show that it can hold over these near-term resistance levels.
Support Architecture Holds at $0.107 Despite Six Tests
There is strong resistance to the rise between the monthly pivot point of $0.157 and the nearly $0.19 high in December. The current upper limit is $0.146 where the compressed EMAs and the previously supported recorded resistance converge. Sellers defended strongly at $0.157 during 3 rallies, so this is the key level bulls need to cross to confirm a trend change.
Bulls are protecting an important support cluster between $0.107 and $0.125, which is based on November’s consolidation lows and the psychological round number. This area has withstood six distinct selling waves over the last eight weeks without being breached, indicating that institutional buyers likely consider these prices to be at a discount. The weekly pivot at $0.097 acts as a last line of defense, but breaking the $0.107 floor would probably lead to stop-losses being hit en route to $0.075.
The setup in Hedera’s HBAR-token is equally potent. If the token saves the monthly (black) and yearly (blue) pivot at $0.10 in the March 6 close, the loftier targets at $0.114 and $0.14 will come into reach. The token is on track to establish a monthly and quarterly opening range breakout.
Bulls Need Decisive Close Above $0.146 to Shift Momentum
If the price reclaims the 20-day EMA at $0.146, bulls will try to push the digital currency to the monthly pivot at $0.157 and above it to the resistance line of the ascending channel. A breakout of the channel will be a positive sign that can propel the price to $0.19 and then to $0.20.
If HBAR secures $0.107 as support, renewed buying would quickly encounter resistance at $0.12. Should HBAR price overcome this barrier, the subsequent resistance areas to watch out for lie at $0.135 and $0.15, both likely renewed selling interest points from short-term holders who jumped in during recent spikes.
Based on the technical setup and solidifying underlying support from government utilization, the most likely short-term scenario has HBAR continuing to consolidate within $0.107 and $0.146 ranges as momentum oscillators neutralize higher readings. After ADX supports a directional trade and RSI lifts over 50, the conditions will be in place for a clearer move – with business implementation fundamentals biasing a break to the upside.