APT Plunges 86% From Year-Ago Levels as $1.8B Token Unlock Looms

Market Pulse
- APT trades at $1.91, down 86.5% from last year’s peak amid upcoming $1.8B token release
- Paxos stablecoin launch on Aptos provides institutional liquidity lifeline during weakness
- Technical indicators flash oversold across all timeframes with RSI hitting rare sub-30 territory
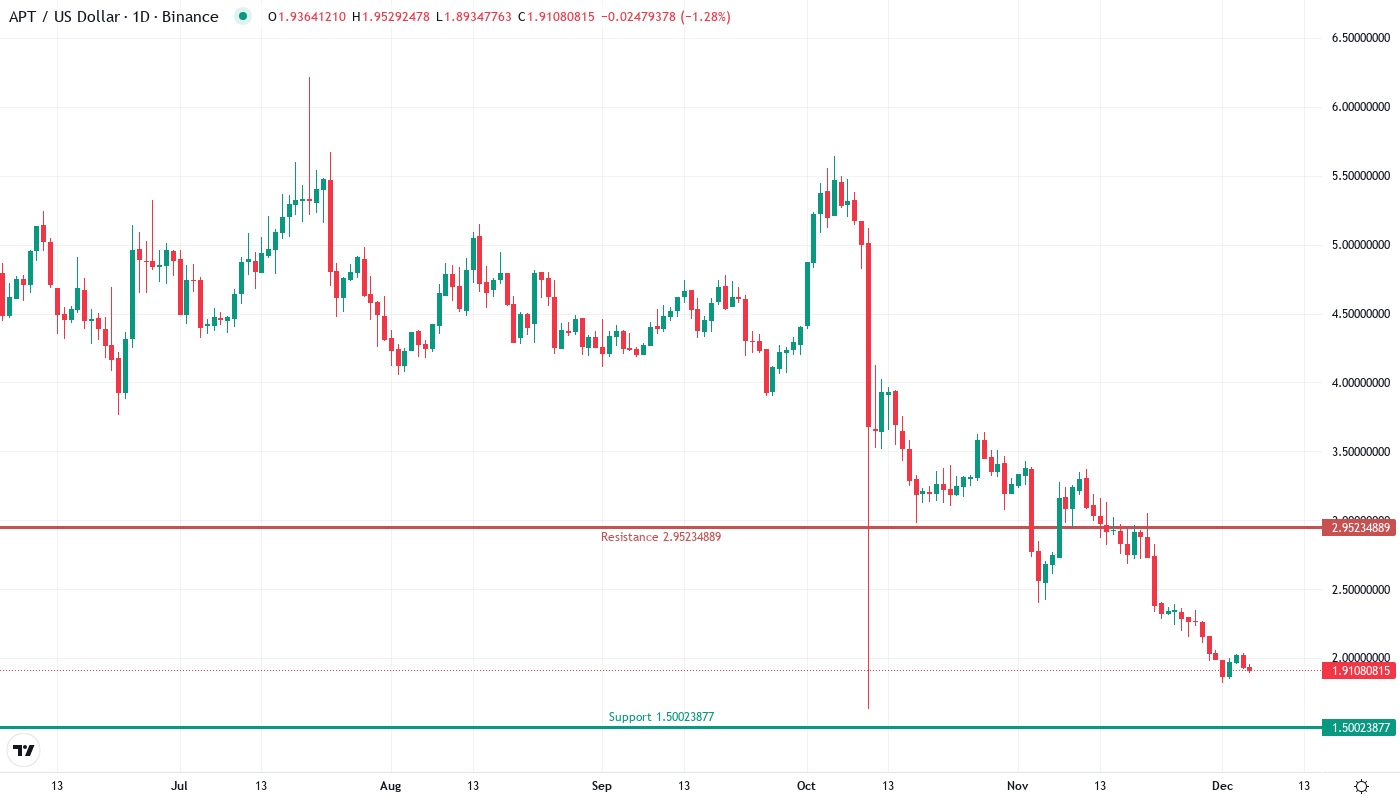
Aptos has endured a devastating 86.5% collapse from year-ago levels, with APT currently changing hands at $1.91 after shedding 55% in just the past six months. The Layer-1 blockchain’s native token now trades near multi-month lows as December’s massive $1.8 billion token unlock casts a shadow over any recovery attempts, though Paxos launching its USDG stablecoin on the network offers a glimmer of institutional interest. The main question for traders is: can oversold conditions spark a relief bounce, or will unlock pressure drive APT to fresh lows?
| Metric | Value |
|---|---|
| Asset | APTOS (APT) |
| Current Price | $1.91 |
| Weekly Performance | -15.79% |
| Monthly Performance | -25.27% |
| RSI (Relative Strength Index) | 27.8 |
| ADX (Average Directional Index) | 47.8 |
| MACD (MACD Level) | -0.30 |
| CCI (Commodity Channel Index, 20-period) | -96.91 |
RSI Hits Extreme Oversold Territory Below 28 – Rare Capitulation Signal
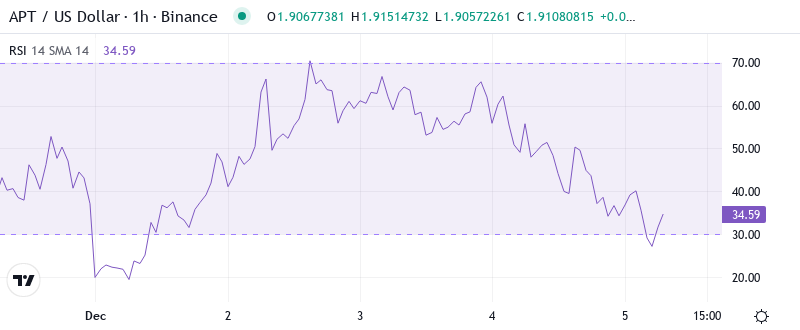
RSI sits at 27.78 on the daily timeframe, marking the deepest oversold reading since the broader crypto market washout of 2022. This extreme momentum exhaustion typically signals capitulation phases where weak hands have been thoroughly flushed – historically, such sub-30 RSI prints on major Layer-1 tokens preceded sharp relief rallies of 20-40% within weeks.
What’s revealing is how RSI behaved during the descent: the oscillator spent just three days below 40 before plunging straight to current levels, suggesting an aggressive liquidation cascade rather than gradual selling. So for swing traders, this V-shaped momentum collapse creates conditions for an equally sharp snapback rally, though any bounce faces the headwind of December’s looming token unlock that could cap upside momentum around the 50-day EMA at $2.81.
ADX at 47.76 Confirms Mature Downtrend Nearing Exhaustion
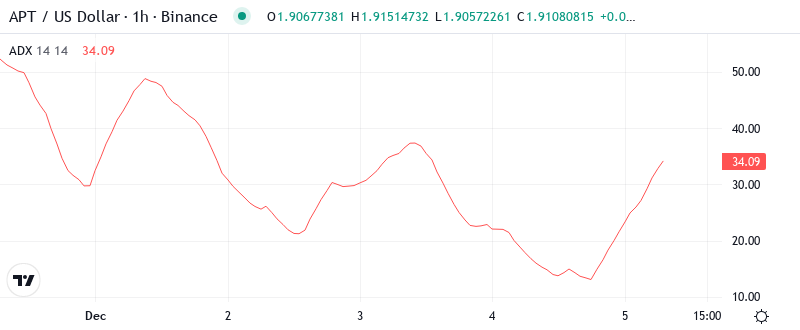
Looking at trend strength, the ADX reads an elevated 47.76, confirming sellers maintained fierce control throughout this decline. Readings above 40 typically mark mature trends approaching exhaustion – at these levels, the directional movement has extended so far that mean reversion becomes increasingly probable. The last time APT’s ADX exceeded 45 was during March’s capitulation bottom, which preceded a 65% relief rally.
Crucially, while the trend remains decisively bearish, such extreme ADX readings often coincide with climactic selling. To clarify, the current setup favors contrarian entries for nimble traders who can stomach volatility, as the combination of deeply oversold RSI and overextended ADX creates a high-probability bounce zone – though position sizing should reflect the ongoing fundamental headwind from the $1.8B unlock schedule.
Price Trapped Below Entire EMA Ribbon Since November Breakdown
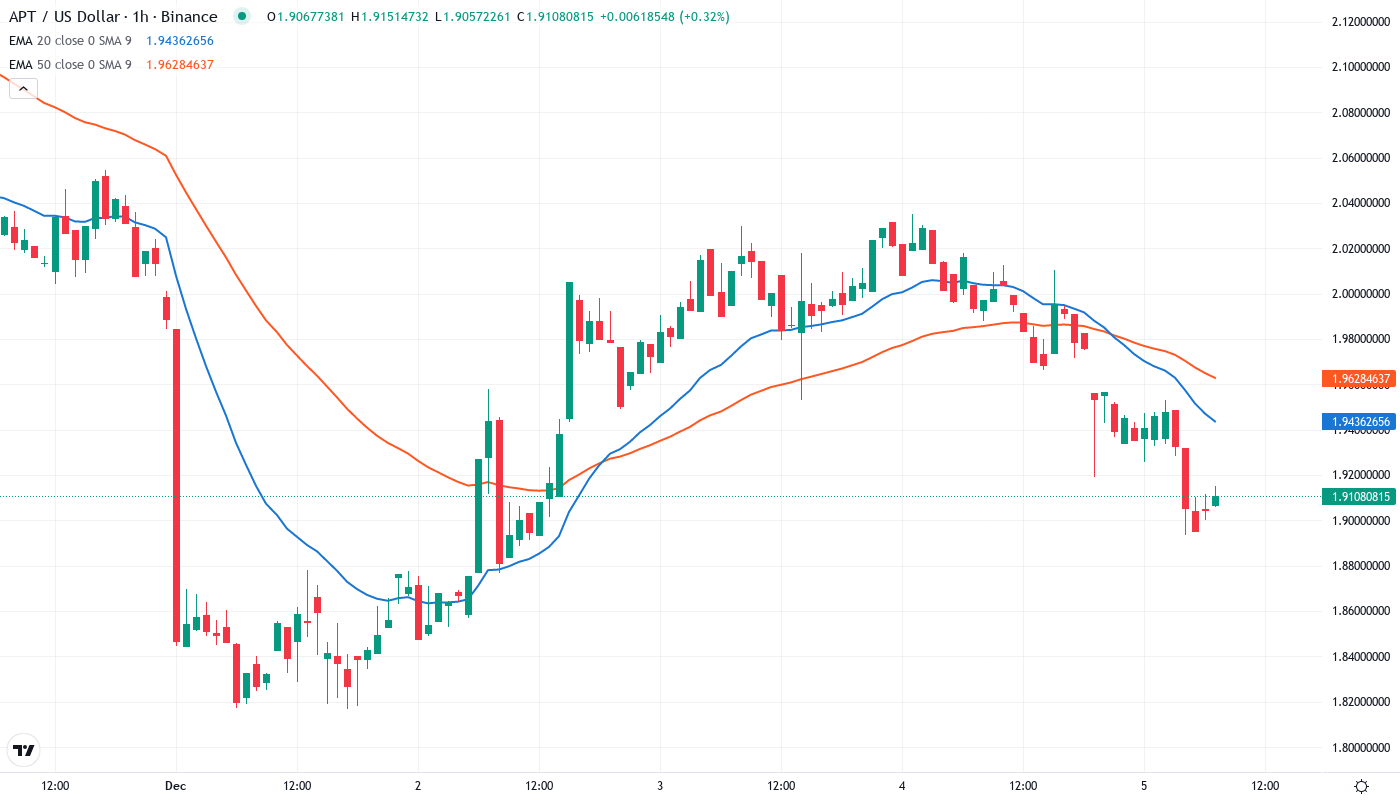
Price action tells a stark story through the EMA structure, with APT trading below every significant moving average. The 10-day EMA at $2.06 rejected recovery attempts three times this week, while the 20-day at $2.28 and 50-day at $2.81 loom as increasingly distant resistance. Most telling is how the 100-day EMA at $3.38 now sits 77% above current price – a gap that illustrates the severity of this downtrend.
Bulls face a daunting task reclaiming these levels sequentially, especially with December’s token unlock providing natural selling pressure at each resistance zone. The 50-day EMA at $2.81 transformed from reliable support throughout summer into formidable resistance after November’s breakdown – any sustained move above this level would mark the first sign of trend structure repair, though the unlock overhang makes such a recovery challenging near-term.
Multiple Support Failures Point to $1.50 as Final Defense Line
Resistance now stacks heavily between $2.25-2.95, where the 20-day and 50-day EMAs converge with horizontal resistance from recent rejection zones. The psychological $2.00 level that provided support throughout October crumbled last week as unlock fears intensified, transforming into immediate resistance that capped yesterday’s relief attempt at $2.05.
On the downside, traditional support levels have failed systematically – the $2.50 zone that held for months gave way in November, followed by $2.00 last week. Bulls now defend the critical $1.82 level where June’s low intersects with the weekly pivot point S1 at $1.50, representing the final support cluster before 2023’s bear market lows near $1.20 come into play.
This market structure reflects genuine distribution as large holders position ahead of December’s supply shock. The repeated support failures combined with expanding volume on down days signals institutional selling rather than retail capitulation alone – a dynamic that Paxos’s stablecoin launch helps offset by providing fresh liquidity channels, though likely insufficient to reverse the primary downtrend.
Bulls Need Decisive Close Above $2.28 to Shift Momentum
Should APT reclaim the 20-day EMA at $2.28 with conviction, bulls could target the gap fill to $2.81 where the 50-day EMA waits. The Paxos stablecoin integration provides fundamental support for such a move, potentially attracting DeFi capital seeking yield opportunities in an oversold Layer-1 ecosystem.
The bearish scenario triggers if $1.82 support cracks on volume, opening an air pocket to $1.50 and potentially $1.20. With $1.8B in tokens scheduled for release, any rally attempts face natural selling pressure from unlock recipients looking to secure liquidity – this overhang could transform each bounce into a distribution opportunity.
Given the extreme oversold conditions paired with looming supply expansion, APT likely stages a relief bounce toward $2.20-2.40 before unlock selling caps the advance. Traders should view any sharp rallies skeptically until the token release completes and the market digests the new supply equilibrium.