Bitcoin Cash Surges 14% Weekly as Volume Explosion Confirms Breakout Above $530

Market Structure Shifts Higher
- Bitcoin Cash (BCH) surged 14.3% this week, breaking above the 50-day EMA.
- The breakout rally was confirmed by a surge in volume.
- The RSI is currently at 60 on the daily timeframe, indicating favorable momentum.
Bitcoin Cash (BCH) surged 14.3% this week breaking above the 50-day EMA. If you read our market analysis, the breakout rally was confirmed by a surge in volume. The RSI is currently at 60 on the daily timeframe, which indicates favorable momentum without extreme overbought conditions.
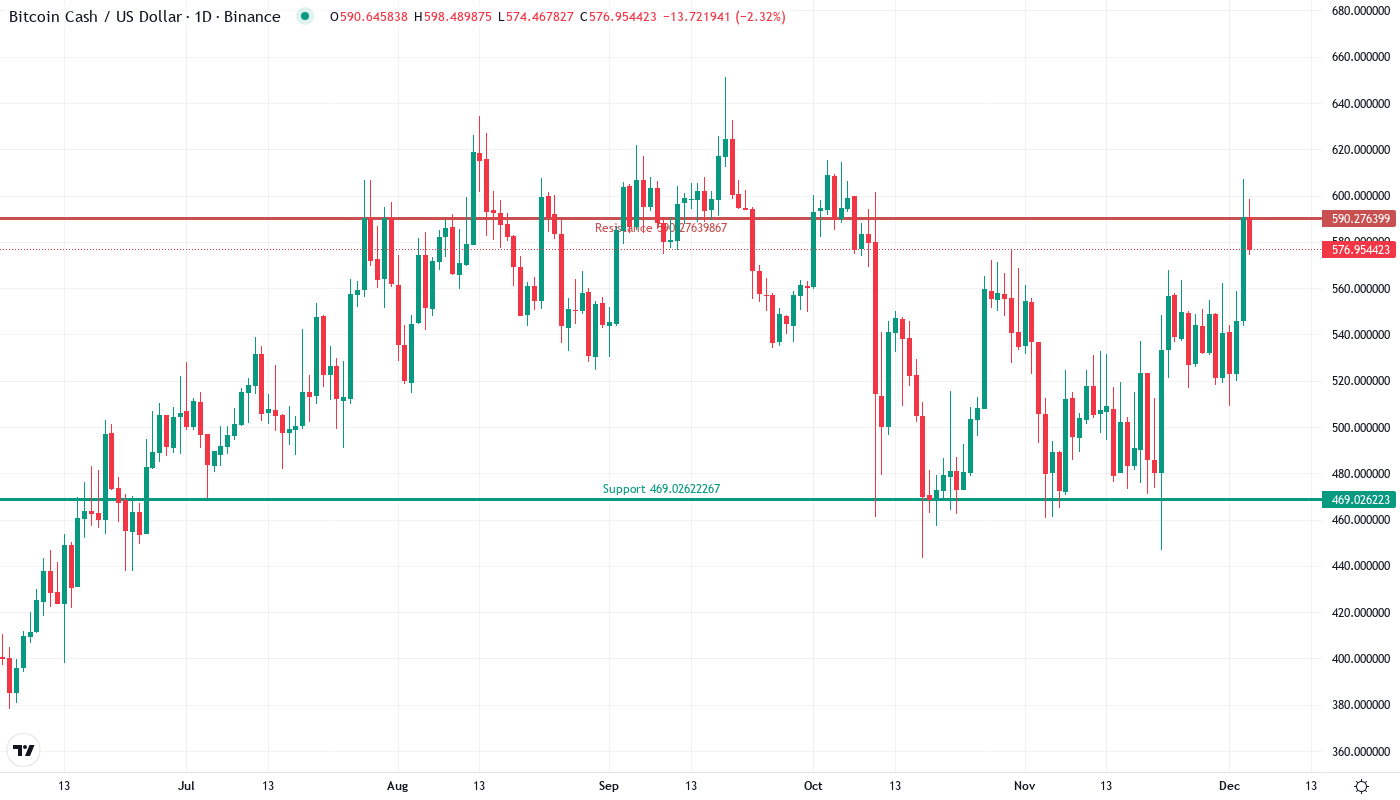
During this sharp weekly move, BCH broke out above the 20, 50, and 100-day moving averages, reclaimed a key recent high that had been residing at the previous technical support level of $551, and it’s now hovering just above that mid-$570s resistance point. If BCH successfully close the week in this upper $570s zone, then traders will start to turn focus toward BCH’s next major upside resistance potential at $603. That is where the weekly 200-day moving average currently resides and where BCH had multiple passes on the way back down during mid to late December.
| Metric | Value |
|---|---|
| Asset | BITCOIN CASH (BCH) |
| Current Price | $577.72 |
| Weekly Performance | 6.22% |
| Monthly Performance | 14.28% |
| RSI (Relative Strength Index) | 58.4 |
| ADX (Average Directional Index) | 20.6 |
| MACD (MACD Level) | 13.05 |
| CCI (Commodity Channel Index, 20-period) | 163.11 |
Momentum Climbs to 60 Without Hitting Overbought Extremes
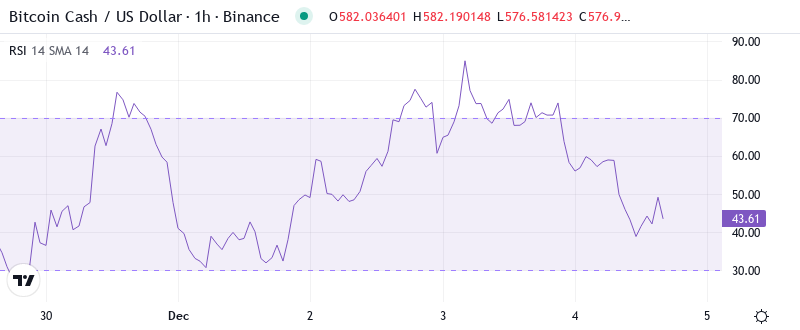
The RSI is at 60.04 on the daily timeframe after last week’s neutral 55.46 reading – momentum is firmly in the bulls favor but with plenty of room for continuation before approaching overbought levels above 70. This balanced momentum surge fits beautifully with the volume explosion out of the BCH base which would indicate real buying enthusiasm rather than a low volume levitation higher.
What is interesting to observe is the behavior of RSI during the consolidation before the jump that happened this week. It was pretty much stable above 50 while the price was going sideways, which means there was solid strength underlying the price move we are currently witnessing. Now, for swing traders, the fact that RSI is at 60 and the weekly is at 58.42 gives good confirmation that there still room to the upside.
ADX at 20.58 Signals Early Trend Development After Range Exit

If we focus on trend strength indicators, the ADX is 20.58, we are no longer in December’s trendless market environment with sub-20 readings, and we can say we are entering a new trend. The +DI is at 23.60 and the -DI is at 10.02 with confirmatory bullish signals.
This ADX level underscored that BCH has escaped the choppy, directionless price action that upset both bulls and bears in December. As such, trend-following strategies become advantageous over mean reversion strategies as the market increasingly demonstrates directional conviction which directly complements the underlying fundmental catalyst of increased investor demand we highlighted in our breakout analysis.
50-Day EMA at $530.61 Flips From Resistance to Critical Support
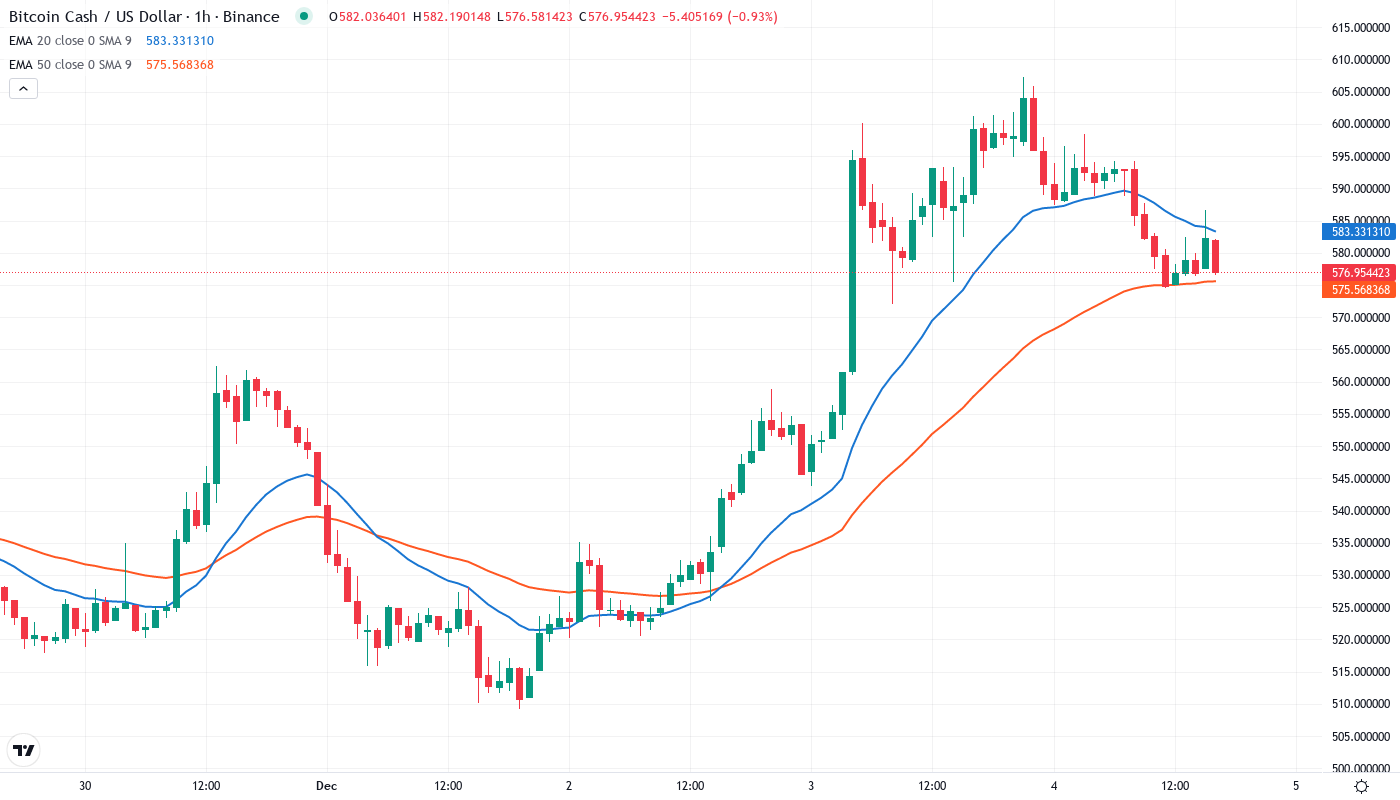
The two longest EMAs have been trending higher for the first time since spring, and the 200-day EMA at $563.44 projects a potential bullish target from here. Rounded to $565 this is in alignment with the horizontal support/resistance at the strong peak of the 10th of November. Overall, the structural setup is quite persuasive.
Even more telling is the compression between short and medium-term averages – the gap between the 20-day and 50-day EMAs narrowed to just $6.74, the tightest reading since October’s rally phase. This MA compression often leads to volatile moves, which is exactly what BCH produced this week. The previous resistance zone at $530-531 now becomes the red line for bulls to defend on any pullback.
Resistance Builds Between December High at $607 and Psychological $600
Sellers will eventually look to target the rising short-term MA line, which has previously provided support in the $545 area. However, buying interest always appears to step in ahead of the average line, which suggests dip buyers are waiting patiently to scoop up discounted BCH. Weakness below the MA would instead likely find support at the top of the prior consolidation zone around $530.
Bulls are defending several support levels below, including initial support at the recently recaptured 50-day EMA confluence at $530-531. The weekly pivot at $527.01 adds more underlying support just below that, with the 200-day EMA support at $511.19 far below and not tested since the beginning of November’s bull run.
Importantly, the market structure continues to indicate sustained buyer dominance as long as BCH remains above $530 on any pullbacks. The October security breach, which impacted multiple cryptos including BCH, seems to have been absorbed by the market, and any negative impact is being outweighed by technical strength, which is attracting new money to this breakout.
Bulls Target $607 Retest as Momentum Builds From Successful Breakout
If BCH can hold above the $530 support cluster going into the weekend, bulls could look to test December’s high at $607.25, which would mark a 11 percent rally from the point of breakout and likely hit stops above the key resistance.
We could see a bearish scenario if the price is unable to stay above the 50-day EMA after a retest, especially if there is low volume during the pullback. If the price closes below $527, this would result in recent breakout buyers being stuck, and we would probably experience a further correction towards $500. At that point, the 200-day EMA may be a good level for a rebound.
Considering the volume confirmation of the breakout earlier this week and the increasingly positive momentum readings on the daily, weekly and monthly indicators, the likely near term scenario is for BCH to consolidate gains in the $560-590 bracket and then have a solid go at the $607 resistance zone, with the breakout story still drawing momentum players to the trade.