Bitcoin Cash Climbs 14% Weekly as Momentum Indicators Flash Buy Signals

Market Pulse
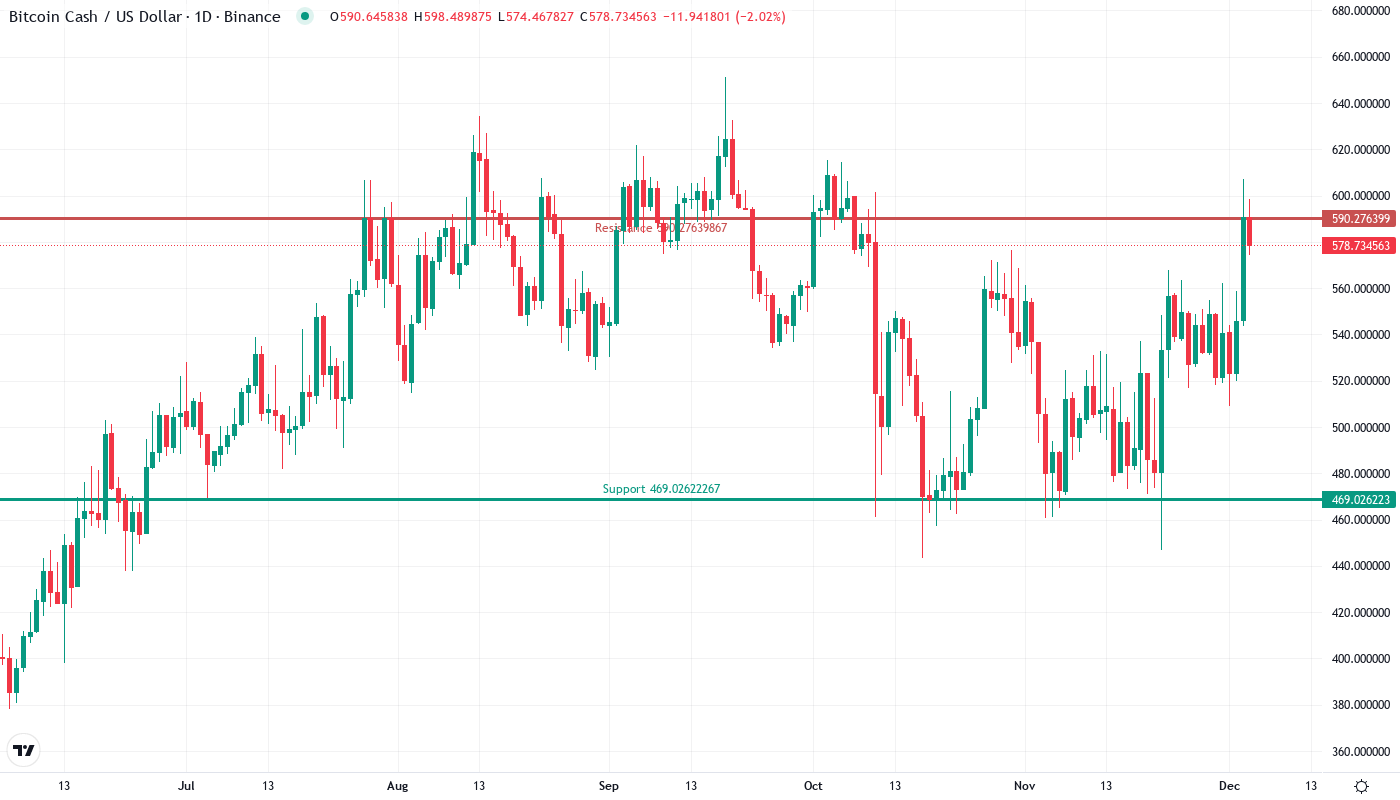
- Bitcoin Cash (BCH) broke through the $575 resistance point to achieve its best weekly performance in months.
- The Relative Strength Index (RSI) remains above 60 and the Average Directional Index (ADX) is strengthening, indicating a bullish trend.
- The $530 level, previously a resistance point, has now become a key support level as bulls protect their reclaimed positions.
Bitcoin Cash made a significant move this week and gained over 14.3% to trade at $577.99. BCH had a slow December but this latest move seems to have erased that sluggish price action. Bitcoin Cash closed the week well above the critical moving averages and on good volume, signaling genuine interest from the buyers and not just a bounce. The question now going forward for short-term traders will be, can the bulls maintain the momentum above the newly flipped $530 support level, or will the sellers drive the price back down at the psychological $600 level.
| Metric | Value |
|---|---|
| Asset | BITCOIN CASH (BCH) |
| Current Price | $577.99 |
| Weekly Performance | 6.27% |
| Monthly Performance | 14.34% |
| RSI (Relative Strength Index) | 58.5 |
| ADX (Average Directional Index) | 20.6 |
| MACD (MACD Level) | 13.07 |
| CCI (Commodity Channel Index, 20-period) | 163.33 |
RSI at 60.07 Signals Controlled Strength Without Overheating
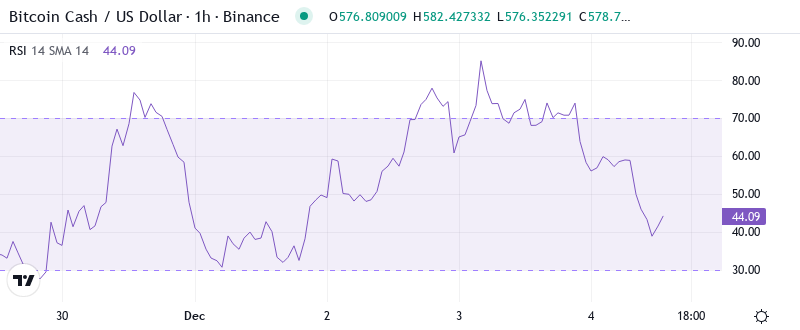
With the oscillator currently at 60.07 on the daily chart, the momentum is viewed as strong but not excessive. This is an optimal reading in terms of sustaining the move. The reading is comfortably above the midpoint line of 50, and as there is no danger level to be found until reaching the 70 area, this momentum also has further ‘fuel in the tank’ if the bulls come to continue their recent good work.
What is interesting is the behavior of the RSI during the consolidation phase. Although prices were oscillating between $520 and $550 in the first 15 days of December, the RSI remained well above 52, indicating that bulls were unwilling to loosen their grip on the market, even during a corrective phase. Further, in September, the RSI witnessed a similar setup before the rally from $350 to $600 levels. However, that rally was also fueled by the rising tide of a bull market, which may not be the case this time, as the market is grappling with the negative news of Mt. Gox bitcoin sales.
ADX Climbs to 20.58 as Market Transitions From Chop to Trend
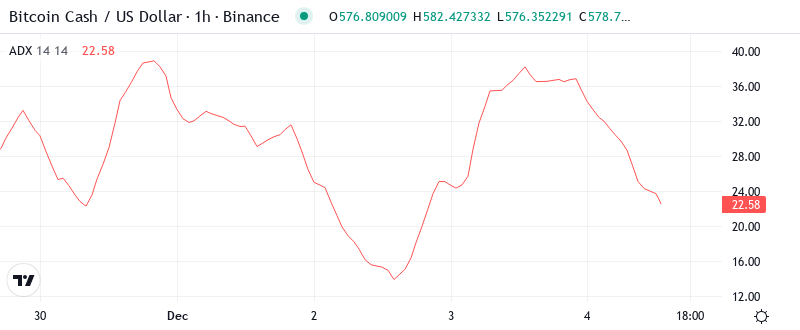
Indicators that measure the trend’s strength show a more positive scenario. ADX, for example, grew to 20.58 compared to the previous week when it was under 15. This means that we are leaving behind that phase of lateral transition that kept us in suspense during December to return to a stage in which the trend followers can get back in the game. When it crosses the 20 threshold, the truth is that it usually sets off an alarm for most momentum players.
To put it simply, even though 20.58 is still not a high enough value to indicate a really strong trend, we should really be observing how the ADX is behaving more than anything else. When the ADX starts to trend higher after a low level of consolidation, it tends to happen before the most powerful trends because the range traders who are stuck on the wrong side of the trade during this low consolidation begin to get stopped out. So, day traders should look to shift from mean reversion to momentum continuation particularly if ADX penetrates 25 in the next couple of sessions.
50-Day EMA at $532 Flips From Resistance to Critical Support
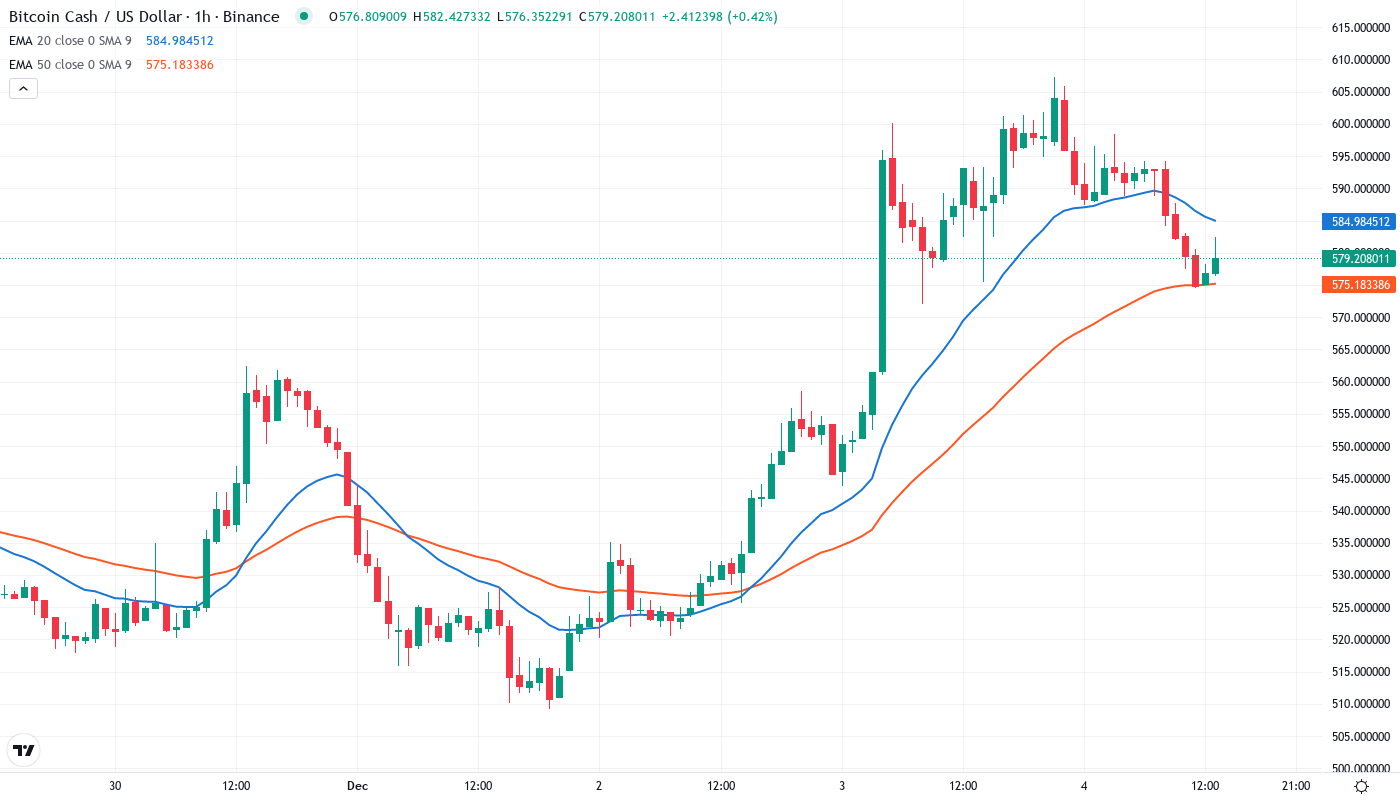
The 4-hour chart is in an uptrend of higher highs and higher lows but shows possible exhaustion in the form of waning momentum. The RSI flashes a bearish divergence and could test the bullish control line if bulls don’t push through resistance, highlighted in orange. The 12-period EMA (blue line) has yet to recapture the 26-period EMA (red line).
Even more compelling are the short and long-term averages crisscrossing closest together since the teaser price gyrations and triggering of the first round of limit orders that launched the ”late unconcerned” from the Eiffel. The 10 day EMA nearly nuzzles the 50 day SMA, with the former just $20 above the latter. This would appear to offer the final haters among us our very last chance to get long prior to missing another 10% of this rally. Or 20%. Or… (Sep – ‘09 anyone? – hell, even mid-’11 was still a crazy time if you were a fan of this red-hot wyrm/Soros…) This is probably the tightest squeeze since this two week period.
Resistance Clusters Between $590-$607 as December Highs Loom
Above the current trading area, sellers have strengthened the $590-$607 region, where the December monthly high at $607.24 converges with key psychological levels. This resistance zone blocked two different BCH advances in the last 30 days, with the price falling below $500 after each attempt. Hence, this zone will likely be the key area for further movement. The monthly pivot R1 at $639.77 will be the next key target if the bulls break above it.
Bulls are defending a stronger support structure following this week’s rally. The nearest floor is located at the confluence of $530-$532, where the 50-day and 100-day EMAs meet, a level that was tested six times since November and held on each occasion. Below that, the monthly pivot of $518.52 offers secondary support, which also coincides with the range of consolidation BCH broke out of this week.
The market structure gives away accumulation characteristics that are often seen in pre-breakout configurations. The higher lows from $447 to $467 to $515 formed a solid base, while resistance points contracted from $640 to $607, and now $590. This contracting triangle tends to lead to fast breakouts, and with BCH recording its initial weekly close above all major EMAs for the first time in a month, buyers seem to be in the driver’s seat for the short term – barring any outside interference from Mt. Gox dumps.
Bulls Target $639 Monthly R1 If $590 Resistance Falls
If BCH can secure a daily close above $590, the measured move takes us to the monthly R1 at $639.77, which is approximately 11% higher from where we are now. This becomes more probable if the overall cryptomarkets continue to recover and fears of Mt. Gox distribution diminish further, as we know January usually brings in institutional money which supports the rising tide for all boats.
If the price does turn bearish and fall below $530, this could trigger a sell-off as recent buyers panic and their stop losses are hit. This could result in the price falling to as low as $467, which was the lowest price seen in December. Additionally, with almost 46% in gains YTD, there is still plenty of profit to take, which could increase the selling pressure.
If BCH doesn’t hold $550 then the next guidepost is $520, and below there, stops are likely run into $500 where there is clusters of long interest struck. A close below $500 may put pressure back on recent resistance and charge layer $470. A close above trailing resistance, which is currently encroaching at $615, is required to alleviate the current downside pressure. If BCH can take out this level, expect $645-660´s to be targeted.