Aptos Tests Critical $2 Support After 27% Weekly Plunge as Stablecoin Catalysts Emerge

Market Structure Shifts Lower
- APT plummeted 27.5% this week, erasing three months of gains in seven days
- Stablecoin launches from Paxos and CreatorFi inject fresh liquidity into ecosystem
- Price trades below entire EMA cloud for first time since October bottom
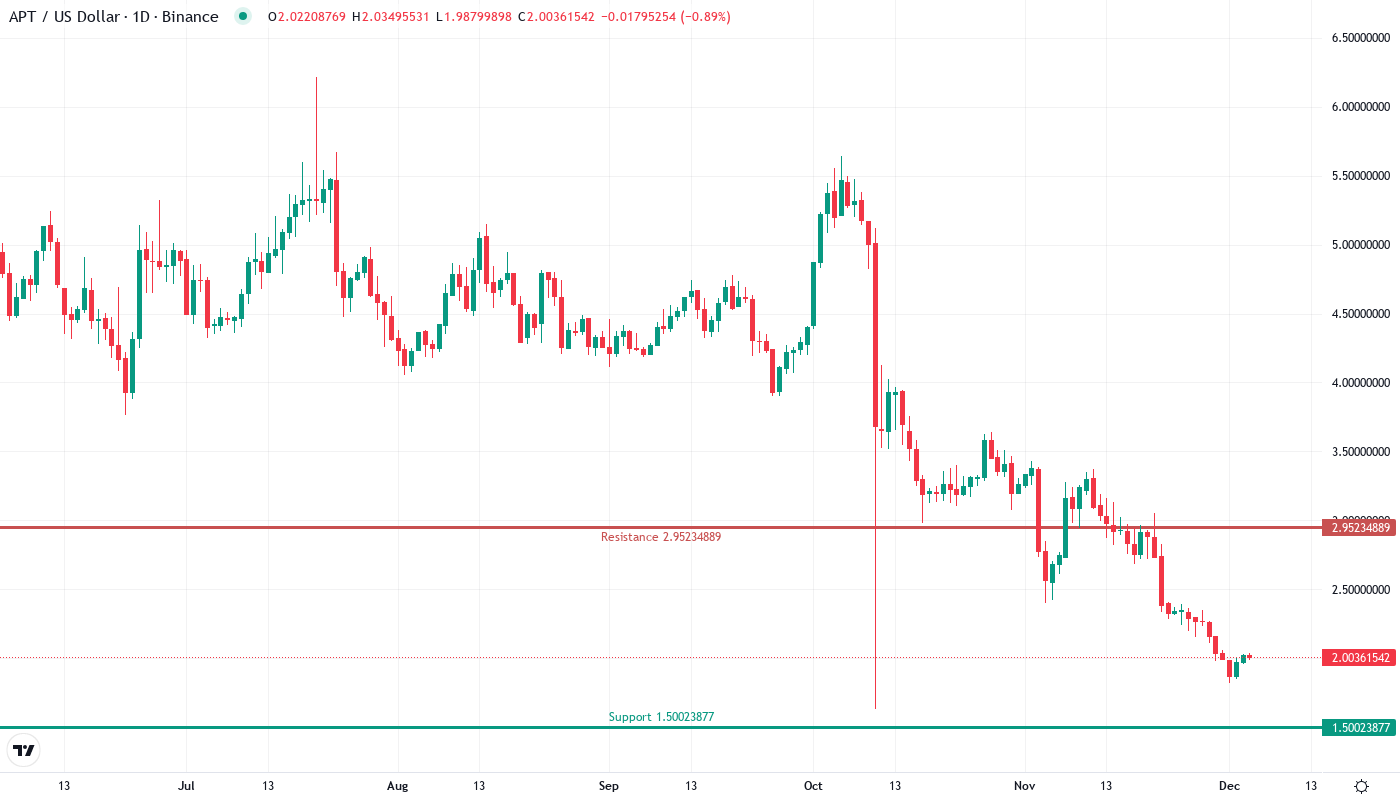
Aptos collapsed from $2.78 to $2.01 this past week, a devastating 27.5% drop that wiped out three months of gains and sent the token careening through multiple support levels. The plunge accelerated after breaking below the psychological $2.50 level, triggering stop-loss cascades as December’s sell-off intensified across altcoins. Interestingly enough, major stablecoin developments hit the wires just as price found support at $2 – Paxos launched USDG0 on the network while CreatorFi secured $2M in strategic backing, potentially providing the liquidity injection needed for stabilization. The main question for traders is: can these fundamental catalysts halt the technical breakdown, or will the looming $1.8B token unlock in December 2025 cast too long a shadow?
| Metric | Value |
|---|---|
| Asset | APTOS (APT) |
| Current Price | $2.01 |
| Weekly Performance | -11.16% |
| Monthly Performance | -27.55% |
| RSI (Relative Strength Index) | 30.2 |
| ADX (Average Directional Index) | 46.9 |
| MACD (MACD Level) | -0.29 |
| CCI (Commodity Channel Index, 20-period) | -81.10 |
Momentum Exhaustion Signals Capitulation Phase – RSI Matches October Lows
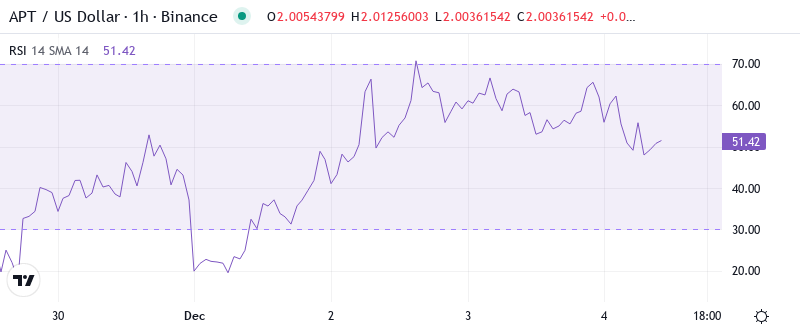
RSI sits at 30.22 on the daily timeframe, marking the first proper oversold reading since October’s market-wide washout. At these levels, momentum exhaustion typically signals either a relief bounce attempt or continued waterfall declines – there’s rarely middle ground. The oscillator hasn’t been this compressed since APT bottomed at $1.81, which preceded a 85% surge to November highs.
What’s revealing is how RSI behaved during the breakdown – it sliced through the 50 neutral line without pause, confirming seller conviction rather than gradual distribution. Similar configurations in September and June both resulted in 15-20% bounce attempts within 72 hours, though neither sparked lasting recoveries. So for swing traders, this oversold extreme presents a clear risk-reward setup: either catch the knife for a quick relief rally or wait for momentum to stabilize above 40 before considering entries.
ADX at 46.94 Confirms Mature Downtrend – Highest Reading Since May Collapse
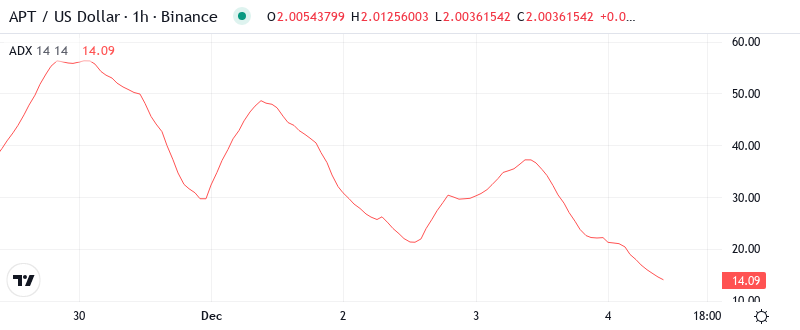
Looking at trend strength indicators, the ADX reading of 46.94 tells a stark story – this isn’t choppy consolidation but a mature, directional move with serious conviction behind it. Basically, when ADX climbs above 40, it signals that one side has taken complete control of the market, and right now that’s clearly the bears. The last time Aptos showed similar ADX extremes was during May’s 65% crash from $9 to $3.
To clarify, the ADX is indicating we’ve switched from the November accumulation phase to full-blown capitulation mode. Trend followers who rode the move down are sitting pretty, while bottom-fishers need to respect that strong trends can persist longer than expected. Therefore, day traders should adapt their strategies to this trending environment – fade the rips rather than buy the dips until ADX drops below 30 to signal exhaustion. The Paxos stablecoin launch provides potential buying interest, but technical structure suggests sellers still dominate.
Price Trapped Below Entire EMA Ribbon – 50-Day MA Becomes Key Resistance
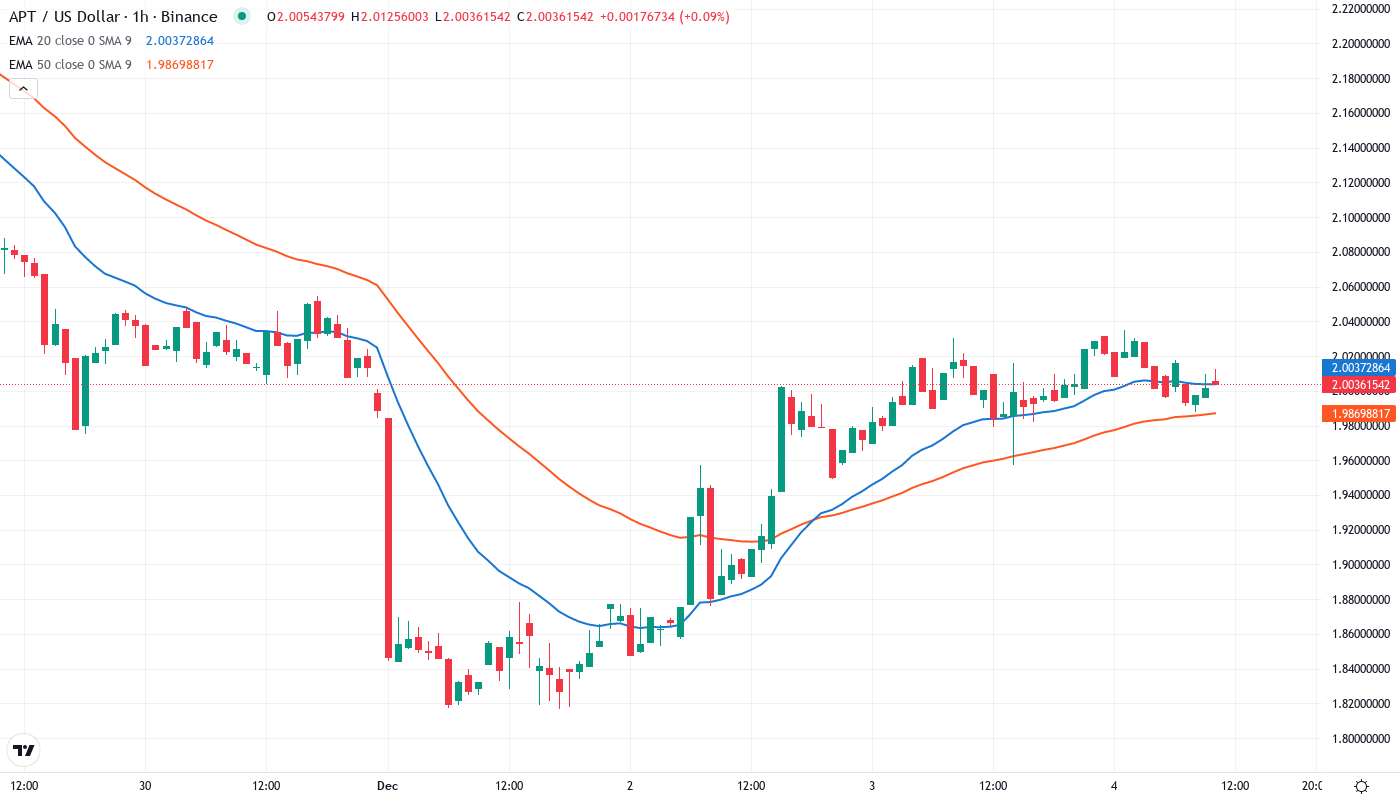
Price action through the EMA ribbons paints a textbook bearish picture. APT currently trades below the 10-day ($2.11), 20-day ($2.33), 30-day ($2.52), and critically, the 50-day EMA at $2.85. Every single moving average has flipped from support to resistance during this week’s cascade, creating a stacked resistance zone overhead that bulls must reclaim to shift structure.
Most significant is the 50-day EMA’s transformation – this level supported price action throughout October and November before finally breaking on December 9th. That former support at $2.85 now becomes the red line bears will defend on any relief bounce attempts. The 100-day EMA lurks much higher at $3.41, so bulls face multiple resistance layers even if they manage to recapture the psychological $2.50 level. With CreatorFi’s $2M backing announcement, there’s potential catalyst fuel, but price needs to prove it can hold above at least the 10-day EMA to signal even a temporary bottom.
Support Architecture Crumbles Below $2 – Monthly Pivot Provides Last Defense
The immediate resistance stacks heavy between the daily 10-EMA at $2.11 and the psychological $2.50 level where December’s breakdown accelerated. Above that, the 50-day EMA at $2.85 and the monthly pivot at $3.18 create a formidable ceiling. Bears have successfully defended every bounce attempt at the 10-day EMA for the past five sessions, confirming their control of near-term structure.
Bulls desperately defend the $2.00 psychological level, which aligns with October’s low at $1.82 – the last major support before a potential retest of summer’s $1.50 bottom. The monthly S1 pivot at $1.01 seems extreme, but given the 52% drawdown already logged over three months, nothing’s off the table in a sustained downtrend. Volume picked up notably as price hit $2.00, suggesting some accumulation, possibly driven by the Paxos and CreatorFi developments.
This configuration resembles a textbook markdown phase – lower highs and lower lows with each bounce attempt getting sold aggressively. The market structure only improves if bulls can reclaim and hold the 10-day EMA at $2.11 on a daily close. Until then, every relief bounce remains a shorting opportunity for trend followers.
Bulls Need Daily Close Above $2.11 EMA to Halt Bleeding
Bulls require a decisive daily close above the 10-day EMA at $2.11 to even begin discussing trend reversal. If APT can reclaim this first resistance and hold it as support, the next targets become $2.33 (20-day EMA) and ultimately $2.50 psychological resistance. The stablecoin ecosystem developments from Paxos and CreatorFi provide fundamental catalysts that could fuel such a recovery attempt.
The bearish scenario remains intact as long as price stays pinned below $2.11. Another rejection there would likely trigger the next leg down toward October’s $1.82 low, potentially flushing out remaining long positions before any sustainable bottom forms. The looming December 2025 token unlock worth $1.8B creates an overhang that sellers could exploit on any bounce attempts.
Given the oversold RSI, extreme ADX reading, and major support test at $2.00, the most probable near-term path involves a relief bounce toward the $2.11-$2.33 resistance zone before sellers reassert control. Whether that bounce has legs depends entirely on if the new stablecoin liquidity can shift the supply-demand dynamics meaningfully.