APT Slides to $1.99 as Token Unlock Fears Mount – Support Architecture Crumbles

Market Structure Shifts Lower
- APT plunges 40.78% monthly after breaking crucial $2.40 support zone
- Momentum exhaustion signals capitulation phase as RSI drops to oversold territory
- $1.8B token unlock looming in December intensifies selling pressure despite ecosystem growth
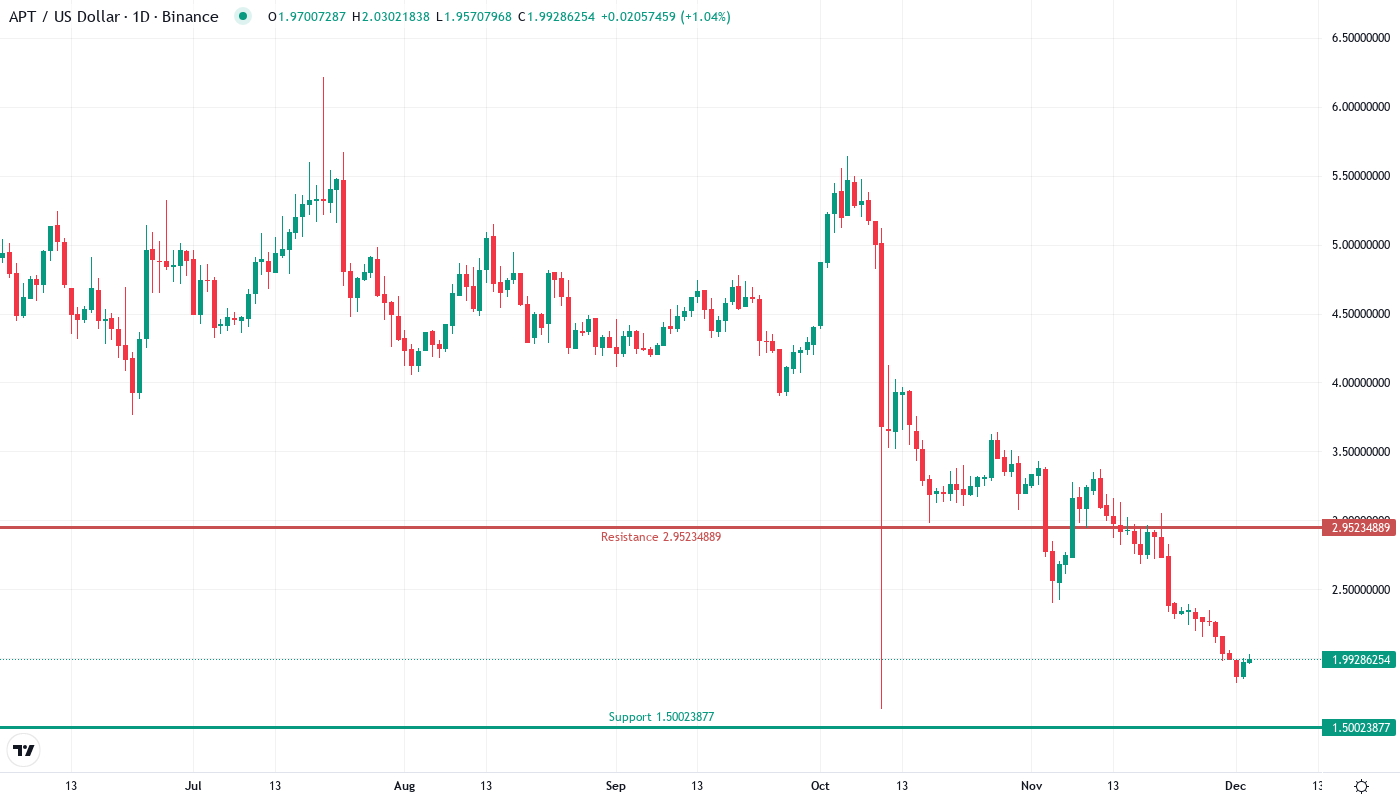
Aptos continues its devastating descent, shedding 40.78% over the past month to trade at $1.99 – a level that marks the collapse of multiple support zones that held throughout 2024. The combination of impending token unlocks worth $1.8 billion and broader market weakness has transformed what began as a correction into a full-scale liquidation event, with the weekly performance showing a brutal 13.16% drop that accelerated as key technical levels failed. The main question for traders is: can any support level halt this freefall before the token unlock avalanche hits, or will sellers continue hunting liquidity all the way down to yearly lows?
| Metric | Value |
|---|---|
| Asset | APTOS (APT) |
| Current Price | $2.00 |
| Weekly Performance | -13.16% |
| Monthly Performance | -40.78% |
| RSI (Relative Strength Index) | 29.1 |
| ADX (Average Directional Index) | 46.4 |
| MACD (MACD Level) | -0.30 |
| CCI (Commodity Channel Index, 20-period) | -89.26 |
Oversold RSI at 38.77 Matches Capitulation Extremes
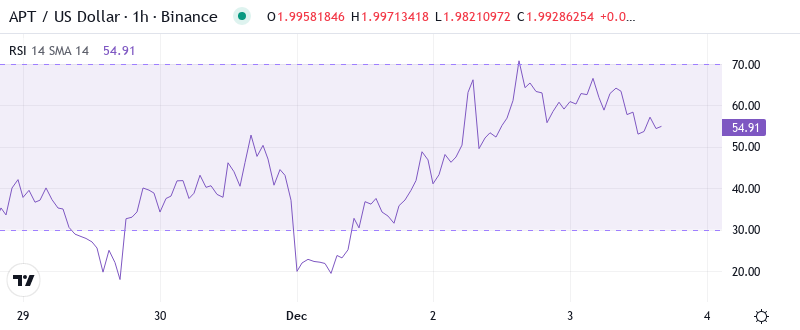
RSI sits at 38.77 on the daily timeframe, diving deep into oversold territory for the first time since the broader crypto washout of summer 2024. This reading signals genuine seller exhaustion is building, though the pace of decline suggests panic hasn’t fully peaked yet – typically, major bottoms in APT coincide with RSI readings below 35, and we’re not quite there.
What’s revealing is how RSI behaved during the breakdown below $2.40 – instead of showing bullish divergence that might signal accumulation, the oscillator confirmed each leg lower with conviction. So for swing traders, this oversold bounce potential exists, but any relief rally faces the headwind of December’s massive token unlock that market participants are clearly front-running.
ADX Spike to 46.42 Confirms Mature Downtrend
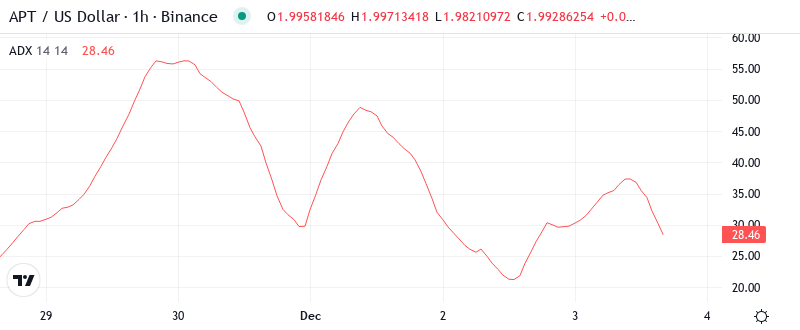
Looking at trend strength, the ADX reading of 46.42 marks one of the strongest directional moves in APT’s trading history. At this extreme level, the indicator suggests we’re witnessing a mature trend that’s approaching exhaustion territory – readings above 45 often precede sharp reversals or at minimum a period of consolidation.
Basically, the combination of extreme ADX and oversold RSI creates a powder keg scenario where any positive catalyst could trigger a violent short squeeze. However, day traders should recognize that with $1.8 billion in tokens set to unlock, any bounce might simply offer better exit liquidity for institutional players rather than marking a genuine trend reversal.
Price Trapped Below Entire EMA Ribbon Since $3.40 Peak
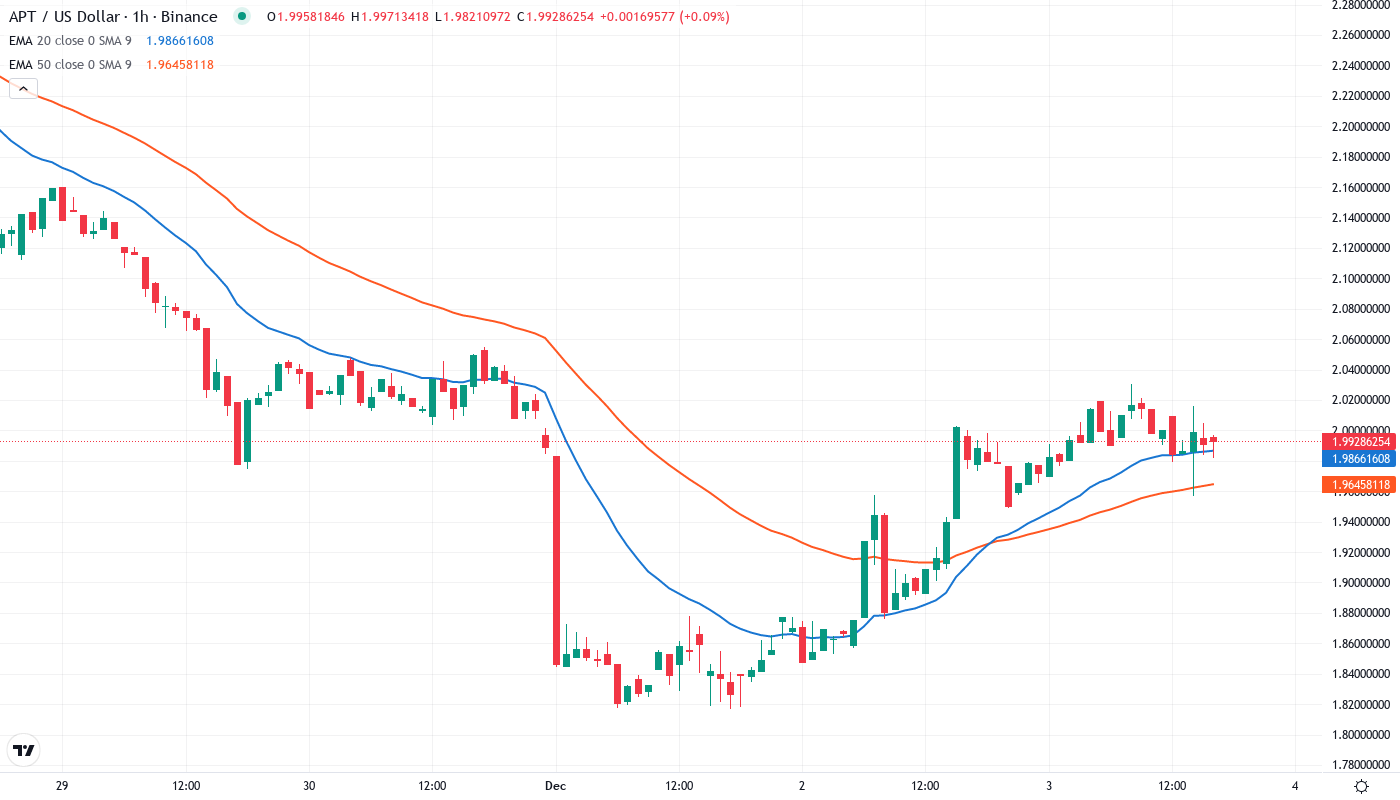
Price action through the EMA structure tells a story of cascading failure. APT currently trades at $1.99, dramatically below the 10-day ($2.13), 20-day ($2.36), 50-day ($2.89), and 200-day EMAs – with each moving average now acting as resistance rather than support. The 50-day EMA particularly stands out as the level that rejected three separate recovery attempts in recent weeks before finally breaking the bulls’ resolve.
Most damaging to the technical picture is how the 20-day EMA at $2.36 transformed from reliable support throughout the autumn rally into a ceiling that capped every bounce attempt. This former springboard for rallies now serves as a red line that bulls must reclaim to even begin discussing trend reversal – and with token unlocks looming, that task grows more daunting by the day.
Support Vacuum Opens Below $1.81 Monthly Low
Below current levels, the support architecture looks alarmingly thin. The immediate support sits at $1.82, marking December’s low, but the volume profile suggests this level lacks the depth to absorb sustained selling pressure. Should this fail, the next meaningful support doesn’t appear until the psychological $1.50 level – representing another 25% decline from current prices.
Resistance stacks formidably overhead, with the first major hurdle at the monthly pivot of $2.26, followed by the broken support zone between $2.36-$2.56 where trapped longs from the recent consolidation will likely supply eager sellers. The December high at $3.37 now feels like ancient history, requiring a 69% rally just to revisit – a sobering reminder of how quickly sentiment can shift.
This configuration screams caution as the market structure shows zero signs of accumulation. Instead, each bounce gets sold into progressively lower highs while support levels crumble like dominoes. The combination of technical breakdown and fundamental overhang from token unlocks creates a perfect storm for continued weakness.
Bears Target $1.50 as Token Unlock Timeline Accelerates
Bulls require a decisive daily close above $2.26 to even suggest the bleeding has stopped, followed by a convincing reclaim of the 20-day EMA at $2.36. Without this, any bounce remains a dead cat rather than genuine recovery, especially given the CreatorFi launch and Paxos stablecoin deployment have failed to stem the selling tide.
The bearish scenario accelerates if $1.82 support breaks on volume, opening an air pocket down to $1.50 where some historical support exists. This would trap recent bottom-fishers who bought the Paxos news, potentially triggering another liquidation cascade as stop losses hit.
Given the technical damage and looming supply shock from December’s unlock, the most probable near-term path sees APT grinding between $1.82-$2.26 in volatile chop before the unlock event forces direction. Risk-conscious traders should size positions accordingly – this knife is still falling, and catching it prematurely could prove costly.