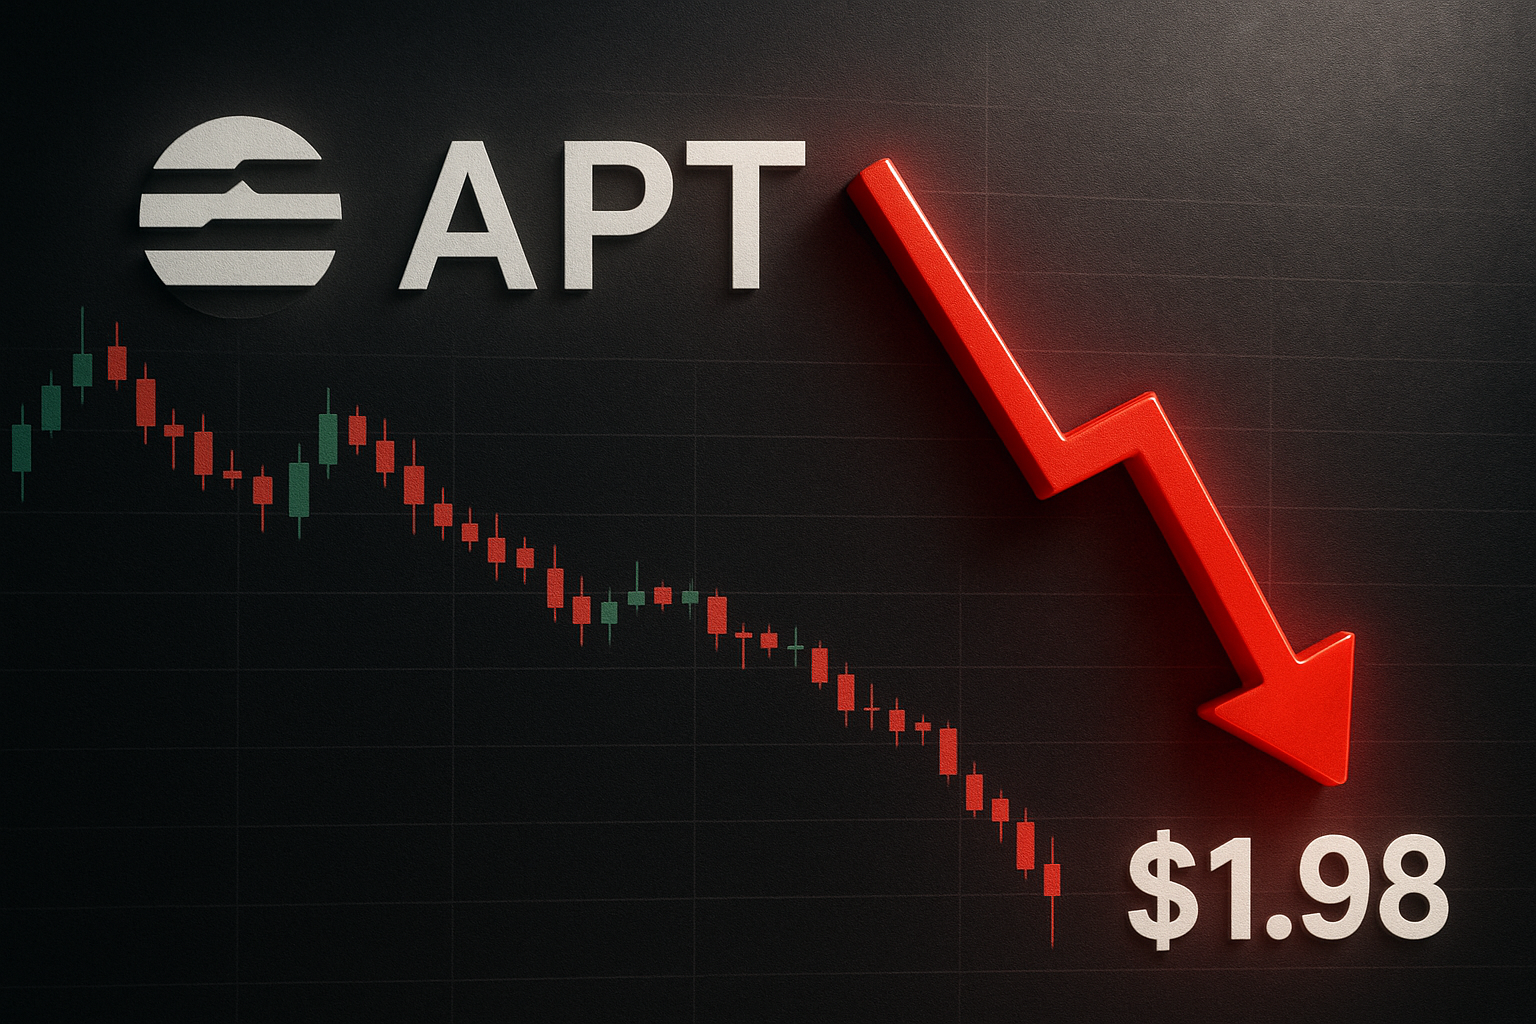
Aptos Plunges to $1.98 as Token Unlock Fears Compound Technical Breakdown
Market Structure Shifts Lower
- APT crashed 13.5% this week, extending December’s brutal 41% collapse
- ADX climbs past 46, confirming genuine downtrend momentum taking hold
- $1.8B token unlock overhang creates persistent selling pressure through month-end
Aptos has entered a devastating freefall, shedding 13.5% over the past week to trade at $1.98 – a level that represents a staggering 41% collapse from December’s highs. The $1.8 billion token unlock scheduled for late December continues to cast a dark shadow over price action, with sellers front-running the supply shock that could flood the market with additional APT tokens. The main question for traders is: can any support level hold against this combination of technical breakdown and fundamental headwinds?
| Metric | Value |
|---|---|
| Asset | APTOS (APT) |
| Current Price | $1.99 |
| Weekly Performance | -13.56% |
| Monthly Performance | -41.06% |
| RSI (Relative Strength Index) | 28.6 |
| ADX (Average Directional Index) | 46.4 |
| MACD (MACD Level) | -0.30 |
| CCI (Commodity Channel Index, 20-period) | -89.03 |
RSI Plunges to 28.57 – Deep Oversold Territory Matches March 2024 Capitulation
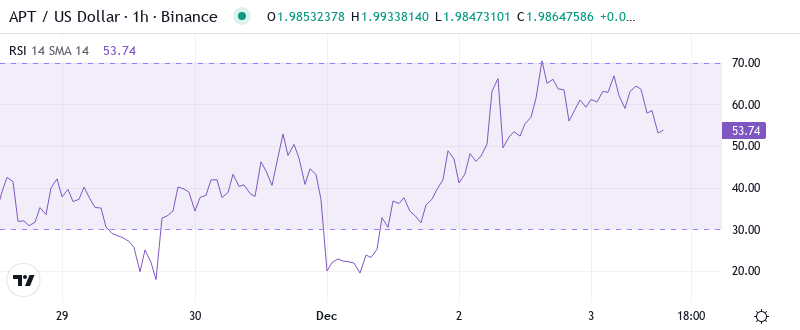
Reading the oscillator at 28.57, traders are witnessing the first genuinely oversold conditions since the March 2024 washout that preceded a 40% relief rally. The momentum exhaustion signals that panic selling has reached an extreme, with weak hands thoroughly flushed from the market. Similar RSI configurations in August and November marked significant local bottoms, though each bounce proved temporary given the persistent unlock overhang.
So for swing traders, this deeply oversold reading creates a high-probability bounce setup – but any rally faces the reality of $1.8 billion in tokens potentially hitting the market. The Paxos stablecoin launch and CreatorFi partnership provide some fundamental support, yet these positive developments pale against the supply tsunami approaching. Smart money might nibble here for a technical bounce while keeping stops tight.
ADX at 46.41 Signals Mature Downtrend Nearing Exhaustion Point
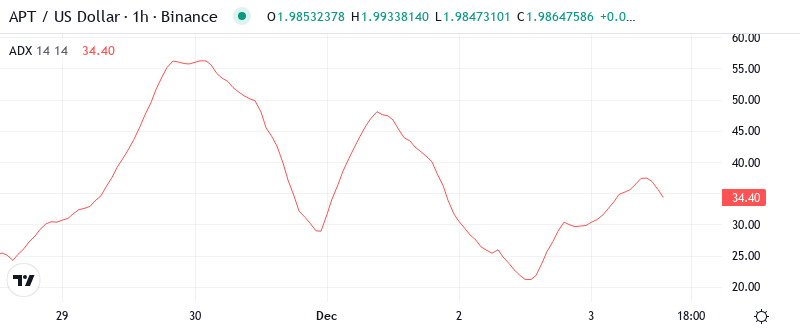
Trend strength readings above 46 mark some of the most intense directional movement in Aptos history. At the level of 46.41, the ADX entry indicates we’re deep into a mature downtrend – the kind that typically exhausts itself within days rather than weeks. Basically, when ADX reaches these extremes, the market has already priced in maximum pessimism and sellers start running out of ammunition.
To clarify, the ADX is indicating that while the trend remains powerfully bearish, we’re approaching the statistical limits of one-directional movement. Therefore, contrarian traders should prepare for increased volatility as the trend loses steam. The combination of extreme ADX and oversold RSI often precedes violent short squeezes, especially when fundamental catalysts like the stablecoin integrations could shift narrative.
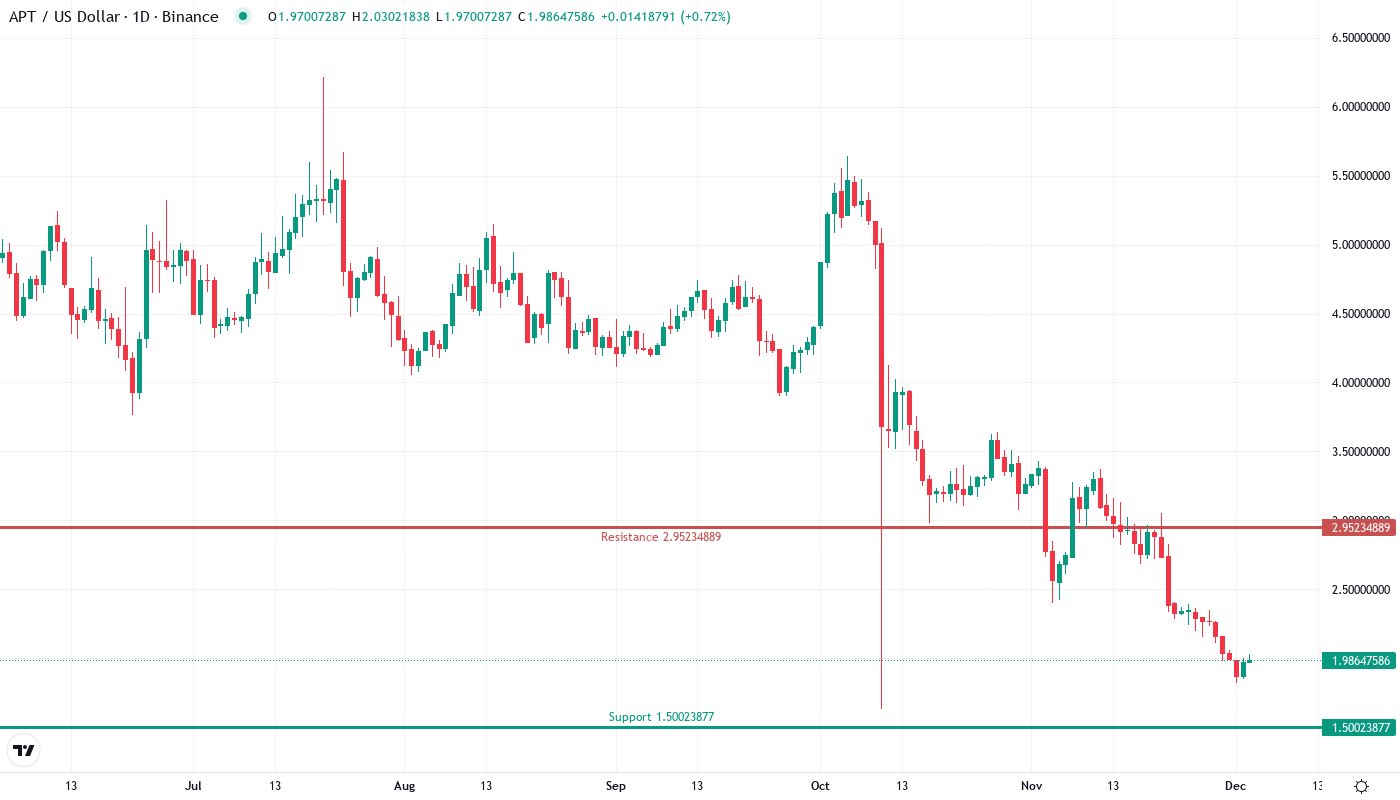
Price Trapped Below Entire EMA Ribbon – $2.88 Now Caps Any Recovery
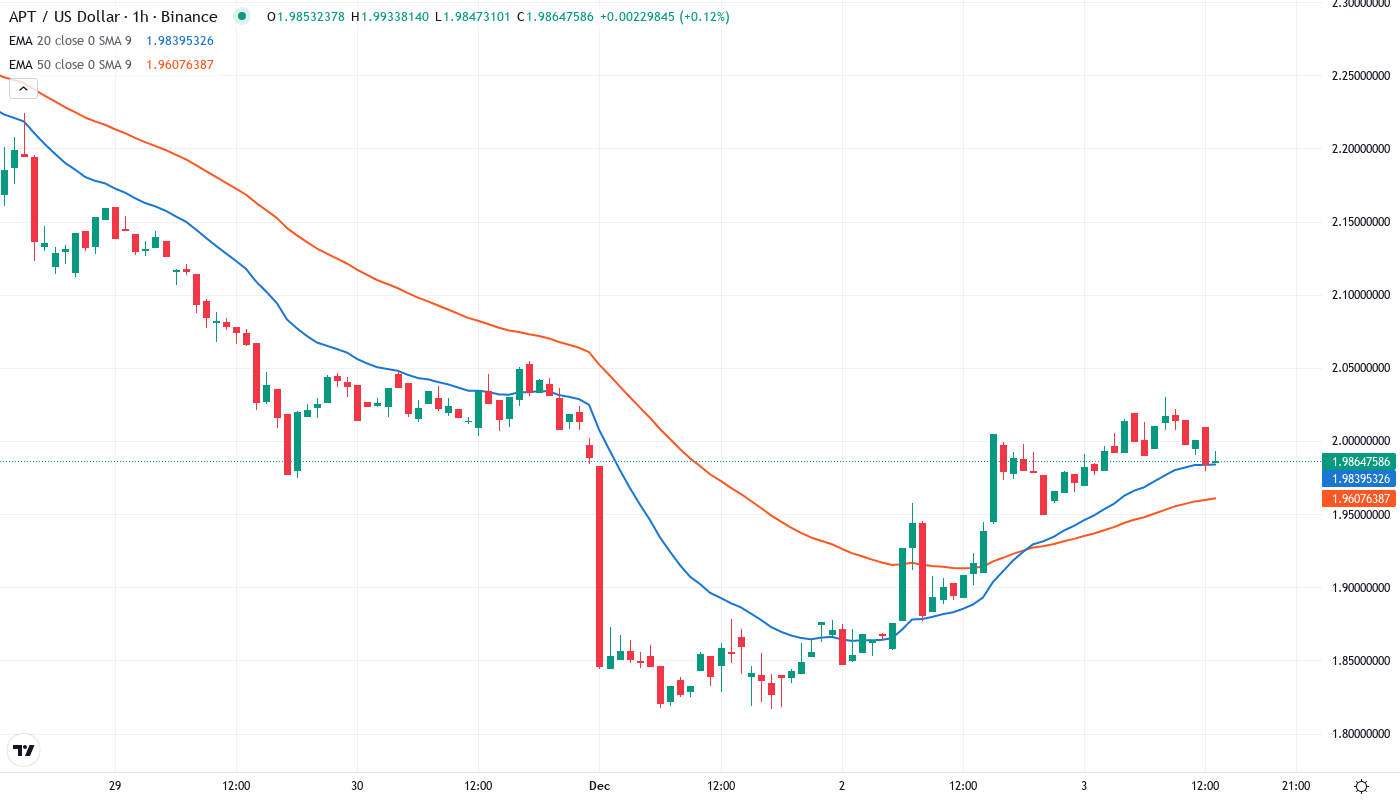
What’s particularly damning is how comprehensively price has broken down through every moving average support. APT trades below the 10-day ($2.12), 20-day ($2.35), 30-day ($2.55), and critically, the 50-day EMA at $2.88. The entire EMA structure has rolled over bearish, with each average now acting as overhead resistance rather than support. Bulls face a mountain to climb just to reach the nearest resistance at the 10-day EMA – itself still 7% above current levels. The 50-day EMA at $2.88 represents the key level that must flip back to support for any sustainable recovery. Until then, every bounce into the EMA cloud between $2.12-$2.88 offers shorting opportunities for those betting the token unlock fears continue dominating price action.
Support Evaporates Below $2 as Monthly S3 Becomes Last Defense at $1.01
Above current price, sellers have stacked formidable resistance between the psychological $2 level and the 10-day EMA at $2.12. The monthly pivot at $2.46 looms as major resistance, having rejected price three times in December before this final breakdown. Even a relief rally would need extraordinary volume to clear this overhead supply.
Bulls defend their final stronghold at the psychological $2 level, though conviction appears minimal given the token unlock timeline. The monthly S1 at $3.17 already failed spectacularly, as did S2 at $2.25. Now traders eye the extreme monthly S3 pivot at $1.01 – a 50% haircut from here that seemed impossible just weeks ago.
This configuration resembles a market in full capitulation mode. The absence of any meaningful support until $1.01 creates an air pocket where price can gap lower on any negative catalyst. The structural damage inflicted by breaking below the entire pivot range typically takes months to repair, especially with $1.8 billion in supply hanging over the market.
Token Unlock Shadow Demands Sub-$1.50 Entries for Risk-Reward
Should APT reclaim the 10-day EMA at $2.12 with conviction, brave bulls could target the 20-day at $2.35 for a 20% bounce. The stablecoin launches provide narrative ammunition for such a relief rally, particularly if broader crypto markets stabilize. However, any strength likely attracts unlock-related selling.
The bearish scenario remains primary – rejection at $2 psychological resistance would target the monthly S3 at $1.01, especially if unlock fears intensify into year-end. This would trap recent buyers who entered on stablecoin news, triggering another cascade lower. Volume patterns show distribution, not accumulation.
Given the technical devastation and $1.8 billion unlock overhang, the highest probability path sees APT grinding between $1.50-$2.00 until the token release completes. Only extremely patient capital should consider entries here, with the understanding that further 25-40% downside remains plausible before any sustainable bottom forms.