Bitcoin Cash Surges 52.5% as Volume Breakout Confirms New Bull Rally
Market Structure Shifts Higher
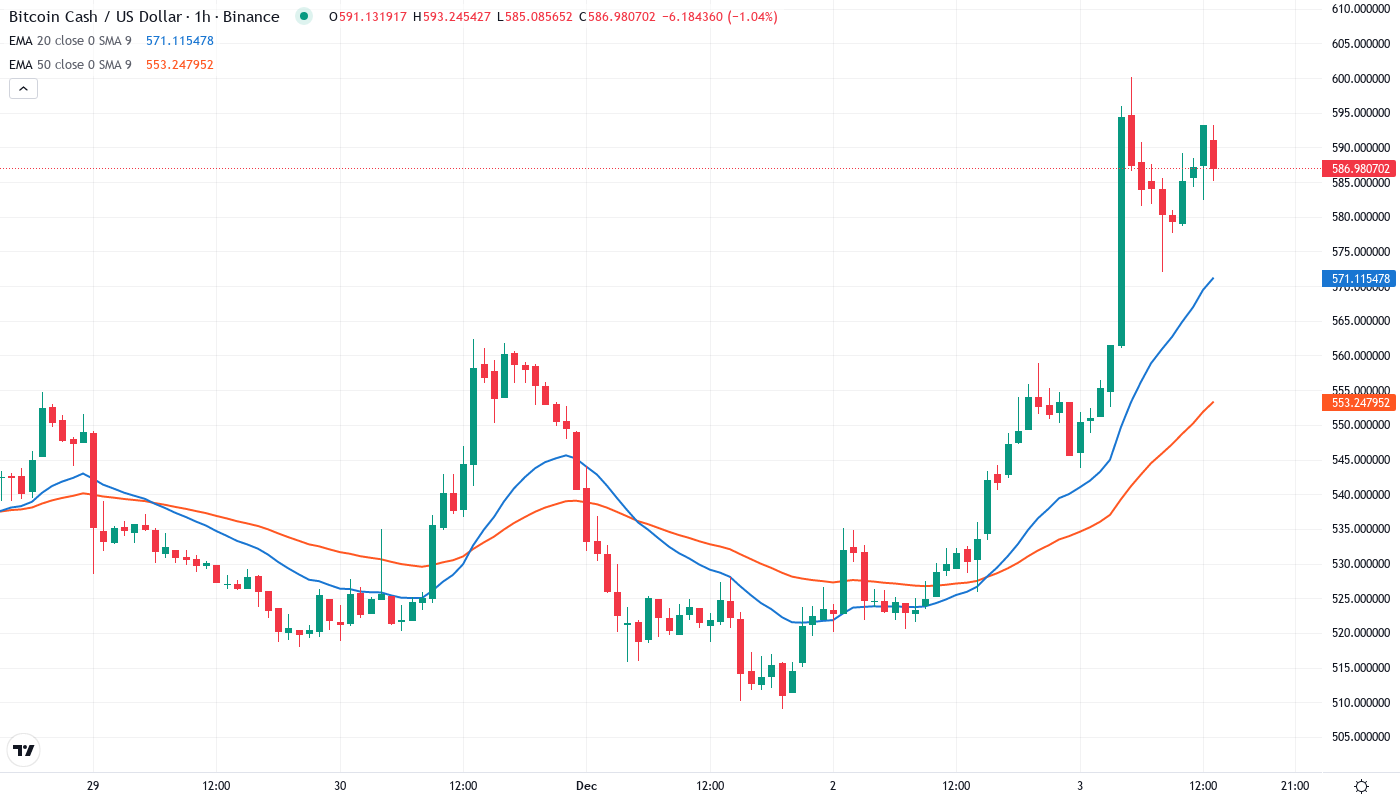
- Bitcoin Cash (BCH) rose 52.5% in January to $587.65.
- Technical breakout validation was confirmed with a significant increase in trading volume.
- A new bullish market trend was established with a base near $447 following the mid-December swing low.
Bitcoin Cash (BCH) has risen 52.5% in January to $587.65, following technical breakout validation and a significant increase in trading volume. The upsurge has now firmly established a bullish market trend following the last local swing low in mid-December, creating a new base near the $447 price point as trading activity turns bullish.
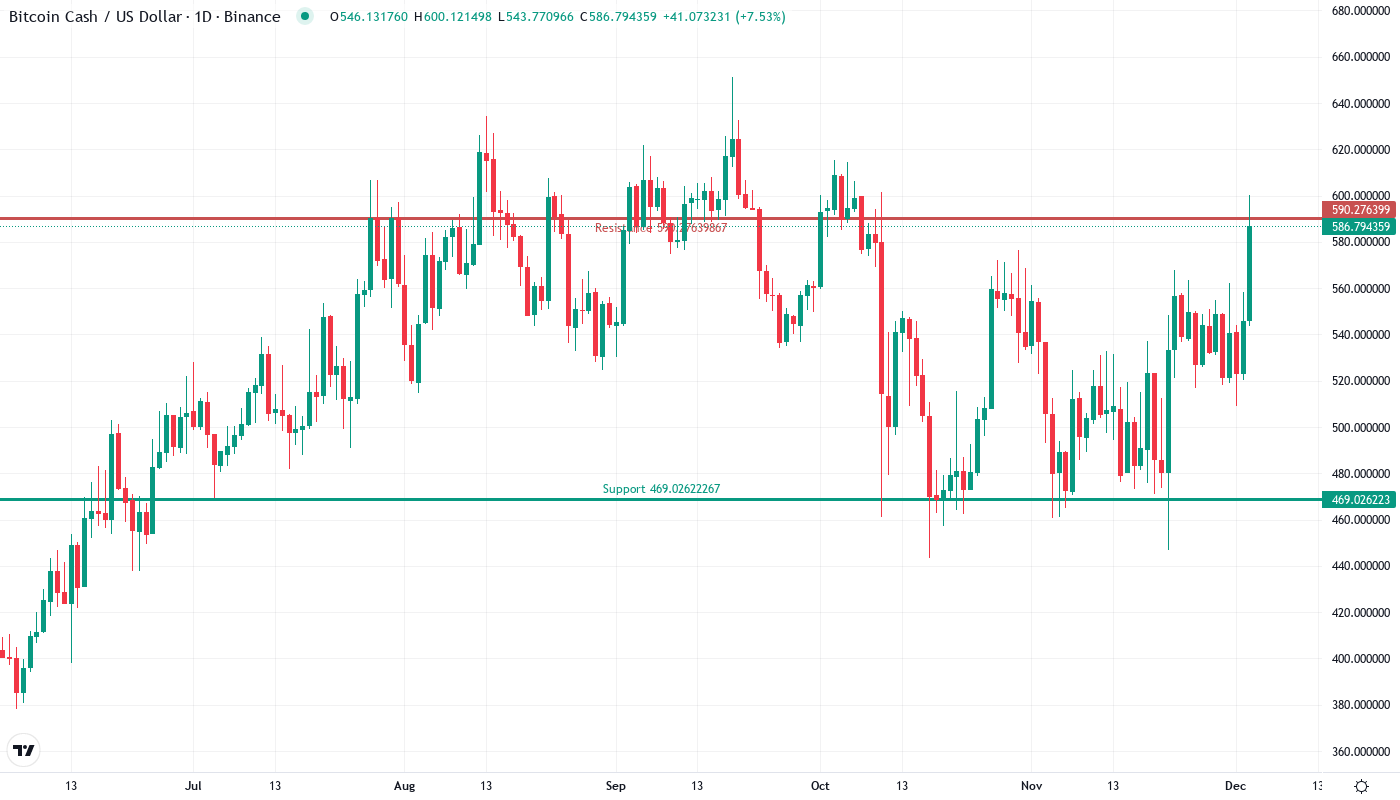
Bitcoin Cash has begun a new contract in bulls, rising 52.5% in the last month to reach $587.65 while increasing numbers of exchanges indicate the move is supported by stronger demand. It’s also caused the all-important technical breakout. The big triple-top resistance level at $530.76 from September to November has finally been broken to the upside. Volume is backing the move. The question asked by every trader is where to now? Can BCH keep the momentum to break the $600 level?
| Metric | Value |
|---|---|
| Asset | BITCOIN CASH (BCH) |
| Current Price | $587.65 |
| Weekly Performance | 11.41% |
| Monthly Performance | 9.49% |
| RSI (Relative Strength Index) | 60.8 |
| ADX (Average Directional Index) | 18.9 |
| MACD (MACD Level) | 10.66 |
| CCI (Commodity Channel Index, 20-period) | 161.16 |
Momentum Stretched to 61.98 – Highest Since Spring Rally
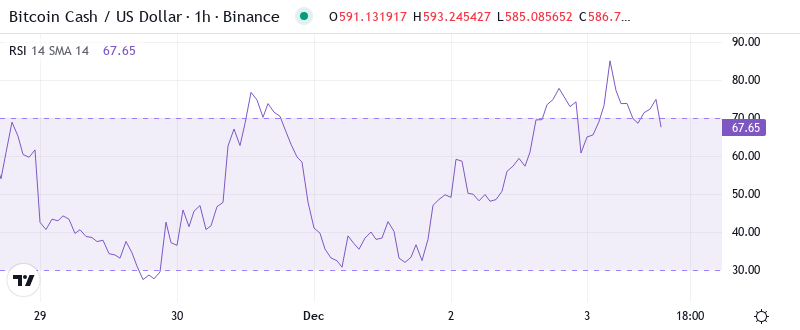
The relative strength index (RSI) is a momentum indicator used in technical analysis that measures the magnitude of recent price changes to evaluate overbought or oversold conditions in the price of a stock or other asset. RSIs are displayed in an oscillator form, most often with the RSI fluctuating between 0 and 100.
What is interesting to note is the behavior of the RSI during the consolidation phase. It stayed well above 50 during the Mt.Gox news, which indicates that the bulls were in no mood to give up, even when $953 million worth of bitcoins were transferred between wallets. Hence, for swing traders, the strong momentum structure suggests that the smaller corrections towards the 50-55 RSI zone should be bought rather than sold, especially after the breakout on volume gives you the underlying fundamental reasoning too.
ADX at 18.89 Signals Trend Building From Compression Phase
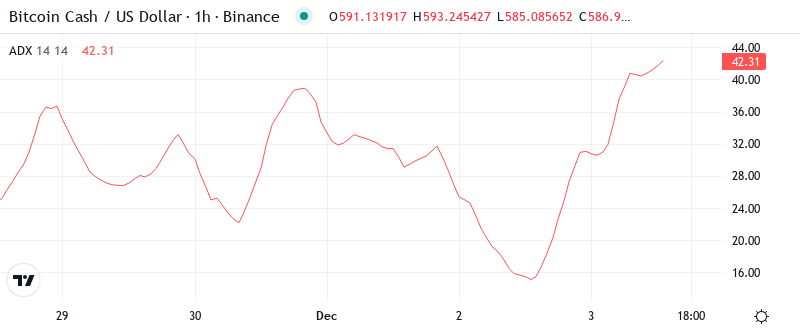
At the 18.89 level, the ADX entry tells that BCH is moving from the choppy consolidation that characterized December and into early new trend movement. Being in this zone indicates that we are grabbing the trend just as it’s born – not too early where false starts predominate, but prior to the crowd catching it and ADX rising above 25.
In other words, the ADX is showing that we are moving from interior conditions in which range traders held the upper hand to an uptrending external state where momentum traders have the advantage. So day traders will want to change over from mean reversion strategies to momentum plays, especially since the amount of trading volume that poured into BCH when it broke resistance is an indication that the big money is taking a position in favor of a prolonged move and not simply looking for a fast profit.
50-Day EMA at $528.56 Transforms From Resistance to Bull Defense
The bearish strikes of December sufficiently cooled RSI and reducing the overbought conditions from the $4,000 region it is now to be in the middle region around 60. The MACD is decisively in bullish territory, and trading volumes have been impressive. Striking distance to the next Fibonacci level of $600 would catch the attention of longer players and fuel momentum. The entire sector is entering a new growth phase.
When looking at the bigger picture, the 100-day EMA is located at $529.85, which is slightly above the 50-day EMA. As a result, these EMAs create a cluster of support ranging from $528 to $530, which is expected to prevent any notable decline. The previously mentioned resistance now serves as a red line that bulls must protect. If they fail to do so, the breakout will be invalidated. However, if they succeed in holding the red line, the continuation to $600 and potentially higher will remain valid.
Resistance Stacks Between $600 High and Monthly R1 at $639.77
The closest resistance can be found between the $600.12 high of this week and the monthly R1 pivot at $639.77. Above monthly resistance, monthly R2 is located at $721.80 as the next important resistance. However, before the latter comes into sight, bulls need to demonstrate that they are able to keep the price above $600 on a daily closing base.
The bulls are trying to keep Bitcoin Cash (BCH) above the moving averages. If they succeed, this will improve the prospects of the resumption of the uptrend. Their first hurdle is the resistance line. If the price turns down from this resistance, the BCH/USD pair could again drop to the 20-day EMA. A strong rebound off this support will increase the possibility of a breakout of the overhead resistance.
The current retest of the weekly levels is happening on declining volume and in decreasing daily ranges (ADR), showing that sellers lack the power necessary to overcome the weekly levels. Put differently, the daily ranges are constricting, showing a loss of seller’s momentum, prevent numbers from going up. The fact that the current weekly level is retested on decreasing volumes gives credence to this interpretation.
Bulls Need Daily Close Above $600 to Confirm Next Leg Higher
In order for that to happen, you would have to see a daily closing above $600.12 which would do exactly that. At that point, the monthly R1 is the next immediate set target. A buzz about a “new bull rally” and a confirmed volume surge would present enough of a catalyst. Should that occur, the measured move from the base of December points in the direction of $700+, which lines up with the monthly R2.
If the price hard rejects at $600 and continues to trend below the key $528 level, this could set off a bearish domino effect that traps recent breakout buyers and pushes the stops down to $500. If the technical levels fail, the Mt. Gox overhang and lingering worries from October’s security breaches could be the negative price mover.
Based on the current momentum structure and volume-confirmed breakout, the most probable near-term trajectory would be for BCH to consolidate between $570-600 and then make a retest of the psychological $600 mark, with the 50-day EMA acting as a rising cushion that would limit any minor retracements.