Aptos Tests Critical $2.00 Support as Bears Dominate December Trade
Market Structure Shifts Lower
- APT slides 12.87% this week, extending December’s 40.59% collapse from monthly highs
- Six-month performance shows devastating -55.37% loss as sellers maintain control
- $2.00 psychological level becomes make-or-break zone for exhausted bulls
Aptos has endured a devastating December, with APT plummeting 40.59% from its monthly high of $3.37 to current levels near $2.00, marking one of the steepest corrections in the Layer 1 space this year. The collapse accelerated after news of $1.8 billion in token unlocks scheduled across various ecosystems spooked investors, though recent stablecoin launches from Paxos and CreatorFi’s $2 million backing provide potential catalysts for recovery. The main question for traders is: can bulls defend the critical $2.00 psychological support, or will the selling pressure push APT toward yearly lows?
| Metric | Value |
|---|---|
| Asset | APTOS (APT) |
| Current Price | $2.00 |
| Weekly Performance | -12.87% |
| Monthly Performance | -40.59% |
| RSI (Relative Strength Index) | 29.4 |
| ADX (Average Directional Index) | 46.5 |
| MACD (MACD Level) | -0.30 |
| CCI (Commodity Channel Index, 20-period) | -88.74 |
RSI at 39 Signals First Oversold Territory Since Summer Bottom
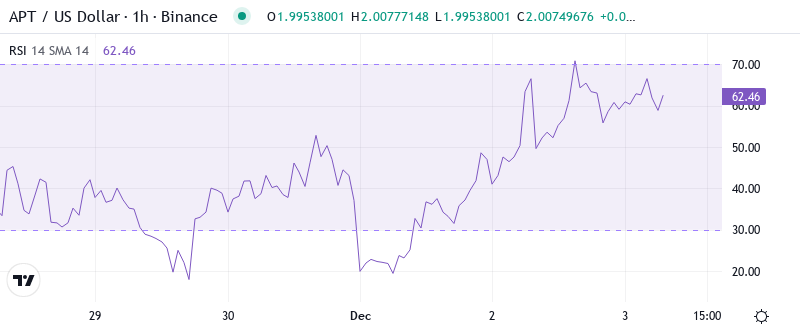
RSI sits at 39.01 on the daily timeframe, marking the first genuine oversold reading since August’s washout that preceded a 45% relief rally. Similar momentum exhaustion levels in July and September both triggered sharp bounces, suggesting sellers may be running out of steam at current levels. The weekly RSI reading of 32.91 reinforces this oversold condition across multiple timeframes, creating conditions ripe for at least a technical bounce.
What’s revealing is how rapidly momentum collapsed – from neutral territory above 50 just two weeks ago to today’s deeply oversold state. So for swing traders hunting a reversal, this RSI configuration combined with the $2.00 psychological support creates an attractive risk-reward setup, especially with positive fundamental developments like the USDG0 stablecoin launch potentially shifting sentiment.
ADX Spikes to 46.52 – Extreme Trend Strength Signals Potential Exhaustion
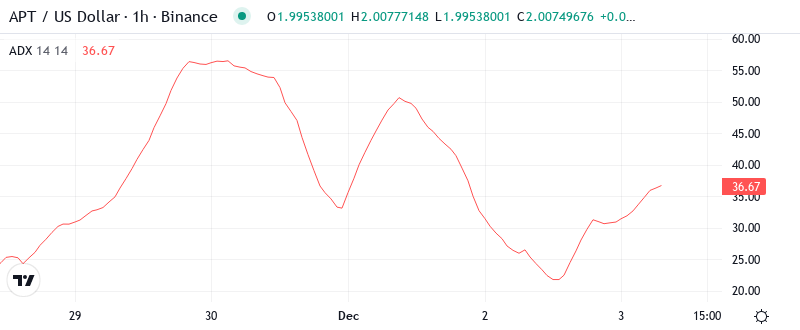
Looking at trend strength, the ADX reading of 46.52 indicates we’re witnessing one of the most powerful directional moves in APT’s recent history. Basically, when ADX climbs above 40, it signals that the prevailing trend – in this case bearish – has reached extreme momentum that often precedes exhaustion. The last time ADX hit these levels was during the March capitulation, which marked a significant bottom.
To clarify, while the high ADX confirms bears have been in complete control, such extreme readings rarely sustain for extended periods. Therefore, day traders should prepare for potential volatility as this overstretched trend either pauses for consolidation or reverses sharply, particularly if the $2.00 support holds firm and the recent positive ecosystem news gains traction.
20-Day EMA at $2.36 Now Acts as Immediate Resistance After Support Failure
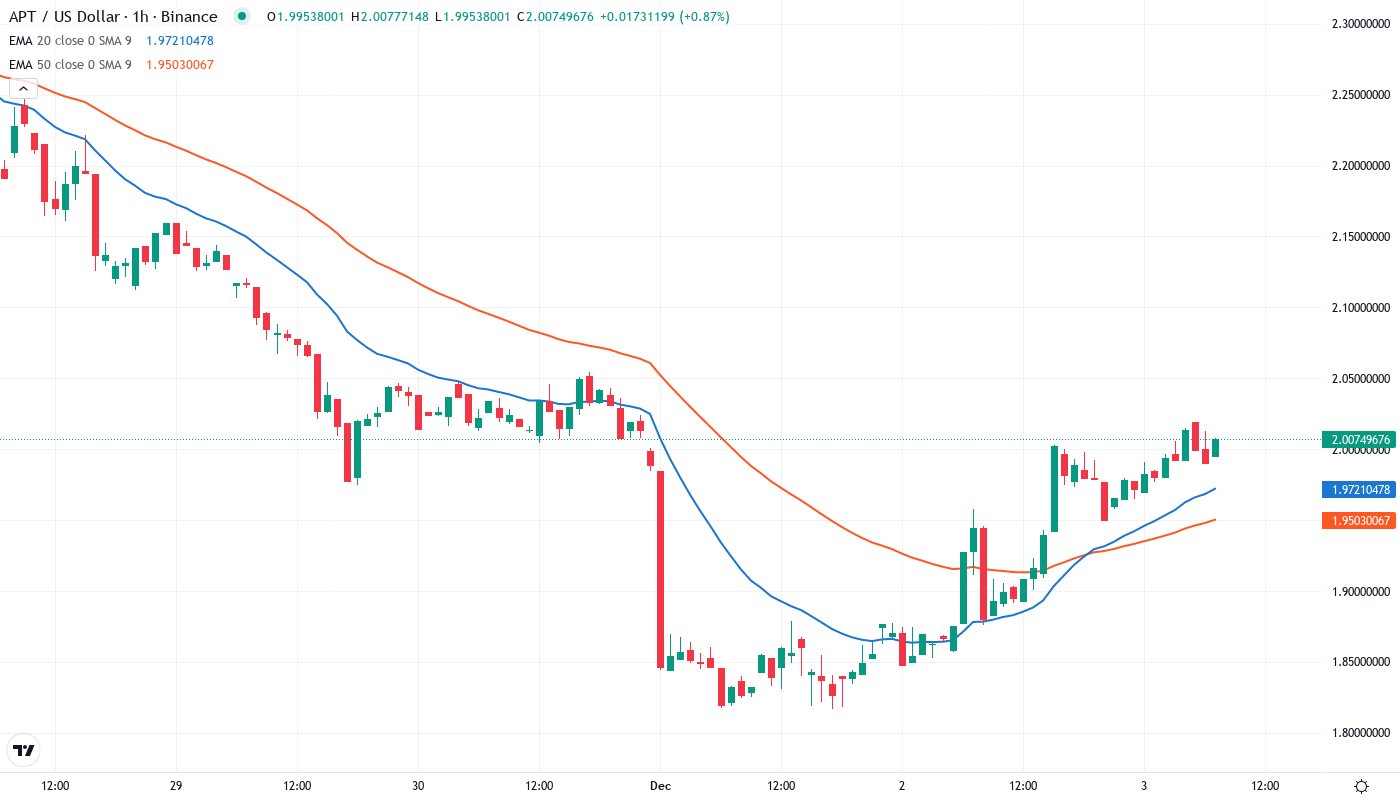
Price action through the EMA ribbons tells a stark story of deteriorating structure. APT currently trades below all major moving averages, with the 10-day EMA at $2.13 and 20-day EMA at $2.36 both flipping from support to resistance during December’s collapse. The 50-day EMA sits much higher at $2.89, representing a 44% premium to current prices – illustrating just how violent this correction has been.
More telling is the compression between current price and the 200-week EMA at $3.44, which hasn’t been tested since the 2022 bear market bottom. This massive gap suggests APT has entered deeply oversold territory on a structural basis, though bulls need to first reclaim the 20-day EMA at $2.36 to signal even a short-term trend reversal. The token unlock overhang clearly accelerated the breakdown through these key averages, but stabilization around $2.00 could set up a relief bounce toward that first resistance.
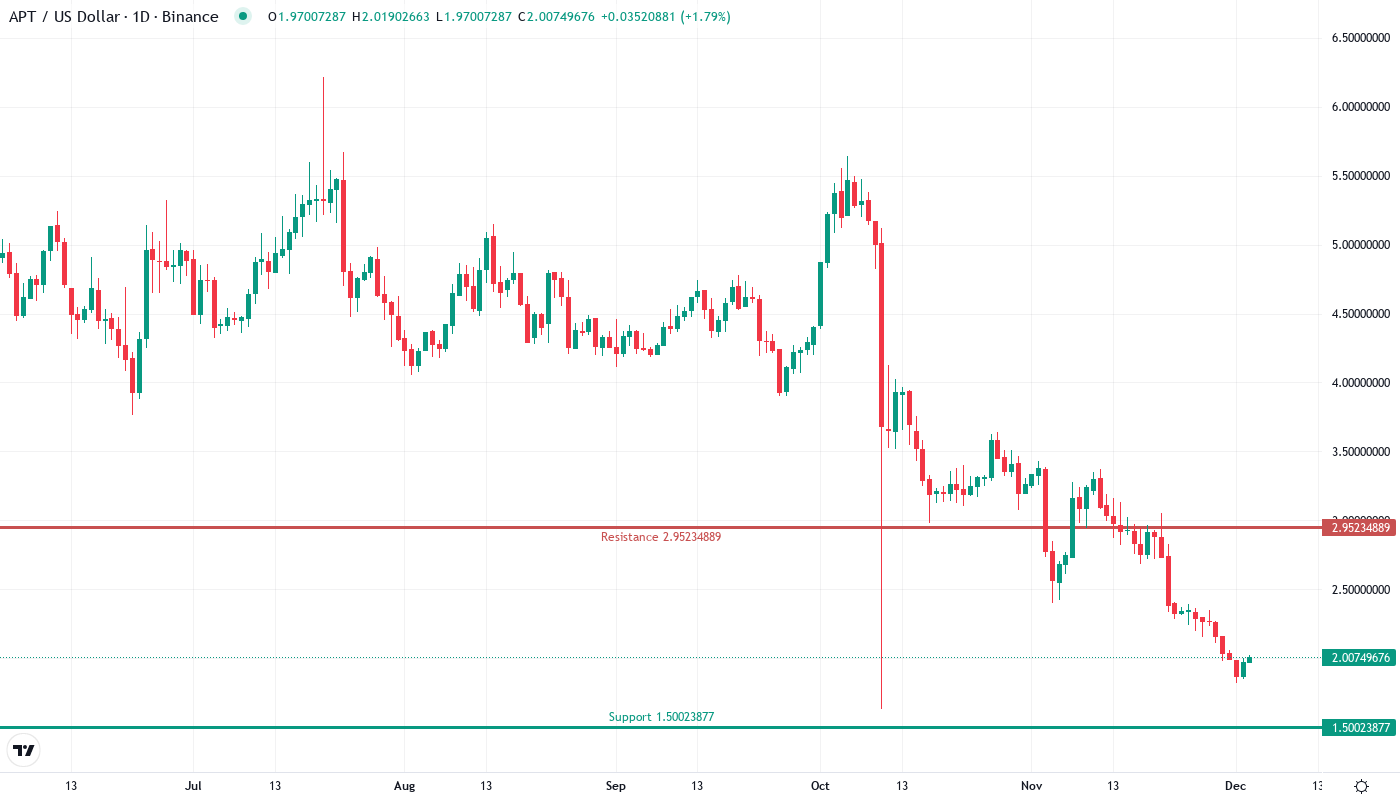
$2.00 Psychological Level Becomes Final Stand for Bulls
Resistance now stacks heavily between $2.25 and $2.97, with the monthly pivot point at $2.25 representing the first major hurdle for any recovery attempt. Above that, the Fibonacci retracement levels at $2.59 and $2.97 align with the broken EMAs, creating a formidable resistance cluster that would require significant buying pressure to overcome – likely needing positive catalyst like expanded stablecoin adoption to fuel such a move.
Bulls currently defend the critical $2.00 psychological support, which has provided bounces on three separate occasions since 2023. This level gains additional significance from its proximity to the yearly low at $1.82, making it a clear line in the sand for remaining buyers. The CreatorFi launch and Paxos stablecoin deployment could provide fundamental support at these levels if adoption metrics start showing growth.
Market structure remains decidedly bearish as long as price stays trapped below the $2.36 20-day EMA, but the extreme oversold conditions combined with major support at $2.00 create conditions for at least a relief bounce. The confluence of technical exhaustion signals and improving fundamental backdrop through new ecosystem partnerships suggests buyers may emerge at these deeply discounted levels.
Relief Rally to $2.36 Most Probable Near-Term Path
Bulls require a decisive daily close above $2.36 to neutralize immediate bearish pressure and open the door for a recovery toward $2.59. Such a move would need to be accompanied by declining ADX readings to confirm trend exhaustion, with the recent stablecoin launches potentially providing the narrative shift needed to attract fresh capital.
The bearish scenario accelerates if $2.00 support cracks on heavy volume, which would likely trigger stop-loss cascades toward the yearly low at $1.82. This outcome becomes more probable if the token unlock fears persist and overshadow positive ecosystem developments, trapping recent buyers who entered on stablecoin news.
Given the deeply oversold technical readings across multiple timeframes and the psychological importance of the $2.00 level, the most likely short-term path is a relief bounce toward the 20-day EMA at $2.36 before sellers reassert control. Traders should watch for potential positive catalysts from USDG0 adoption metrics or CreatorFi traction to fuel any sustainable recovery beyond technical bounce levels.