APT Plunges 40.5% as Token Unlock Concerns Overshadow Network Developments
Market Structure Shifts Lower
- APT trades at $2.00, down 40.5% over the past month as unlock fears dominate sentiment
- Stablecoin expansions from Paxos and CreatorFi provide fundamental support but fail to halt technical breakdown
- ADX surge past 46 signals strong trending conditions – bears firmly in control
Aptos has suffered a devastating drop from its monthly high of $3.37 to current levels near $2.00, shedding 40.5% in just four weeks as concerns over December’s $1.8 billion token unlock schedule triggered widespread selling. The collapse accelerated after price lost the psychological $3.00 level, with stop-loss cascades pushing APT through multiple support zones despite positive developments including Paxos launching USDG0 on the network and CreatorFi securing $2 million in strategic backing. The main question for traders is: can the stablecoin ecosystem expansion provide enough fundamental support to stabilize price before the unlock event hits?
| Metric | Value |
|---|---|
| Asset | APTOS (APT) |
| Current Price | $2.00 |
| Weekly Performance | -12.84% |
| Monthly Performance | -40.56% |
| RSI (Relative Strength Index) | 29.5 |
| ADX (Average Directional Index) | 46.6 |
| MACD (MACD Level) | -0.30 |
| CCI (Commodity Channel Index, 20-period) | -89.40 |
Momentum Exhaustion Hits 39.43 – Matching Historical Capitulation Zones
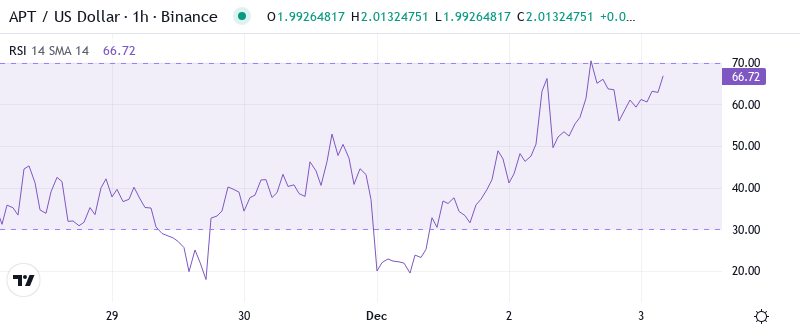
RSI sits at 39.43 on the daily timeframe, marking the first venture into oversold territory since the August washout that preceded a 45% recovery rally. What’s revealing is how momentum collapsed from overbought readings above 70 in early November to current depressed levels in just five weeks – a velocity of decline that typically marks capitulation phases rather than healthy corrections.
Similar RSI configurations in September and October occurred at major bottoms, with the oscillator spending 3-5 days below 40 before sharp reversals materialized. So for swing traders, this oversold reading combined with the upcoming stablecoin launches suggests a relief bounce could emerge, though any rally faces the headwind of looming token unlocks that continue weighing on investor psychology.
ADX at 46.62 Signals Mature Downtrend Nearing Exhaustion Territory
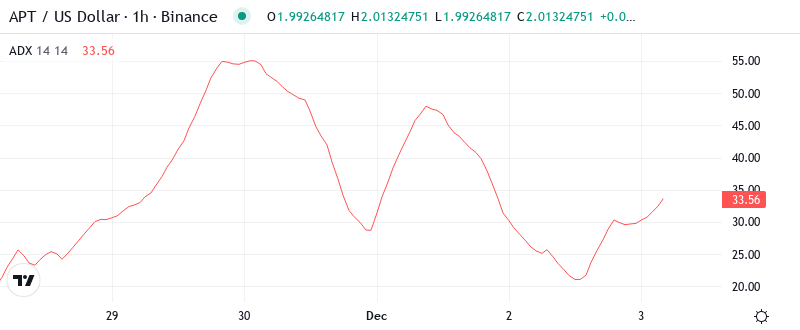
Trend strength has exploded higher with ADX climbing to 46.62, well above the 40 threshold that marks extreme trending conditions. At this level, the ADX entry indicates that while the bearish trend dominates with conviction, such extreme readings historically precede volatility expansion in either direction as trends exhaust themselves.
Looking at prior instances when ADX exceeded 45, the market typically delivered sharp moves within 5-7 trading days – either capitulation wicks that marked bottoms or brief squeeze rallies that reset overbought conditions before continuation lower. Therefore, day traders should prepare for heightened volatility and wider ranges as this mature trend approaches inflection, with the token unlock timeline adding an extra catalyst for dramatic price swings.
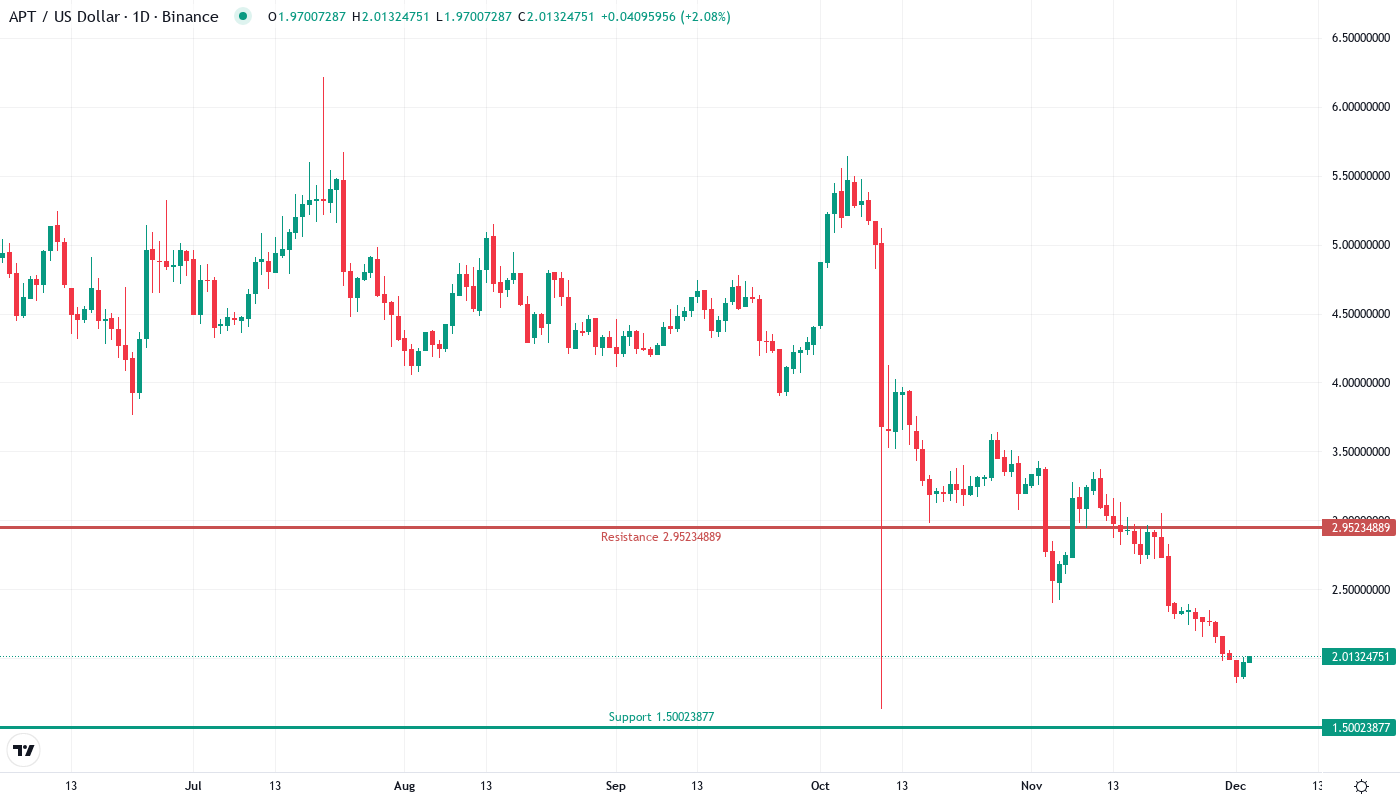
20-Day EMA at $2.36 Becomes First Resistance After Month-Long Breakdown
Price action tells a clear story through the EMA structure – APT trades below the entire moving average ribbon from the 10-day ($2.13) through the 200-day (not yet established), with each average now acting as overhead resistance. The 20-day EMA at $2.36 rejected recovery attempts twice this week, confirming the bearish market structure remains intact despite oversold bounces.
Most telling is the compression between the 50-day ($2.89) and 100-day ($3.44) EMAs far above current price, creating a resistance cluster between $2.89-$3.44 that would require significant buying pressure to overcome. That former support zone now transforms into a formidable barrier, particularly with the psychological impact of pending token unlocks keeping buyers cautious about committing capital ahead of potential supply expansion.
Support Crumbles at $2.00 as Monthly Lows Provide Final Defense
Sellers have systematically destroyed support levels during this decline, with the psychological $3.00 mark giving way to accelerated selling that sliced through $2.50 and $2.25 without pause. The immediate resistance stacks between the daily pivot at $2.25 and the weekly pivot at $2.95, representing a 47% overhead supply zone that caps any relief rallies.
Bulls defend the final support at the monthly low of $1.82, which aligns with the monthly S2 pivot at $1.50 to create a critical demand zone. This level has attracted buying interest three times in the past week, suggesting accumulation despite the token unlock overhang, possibly from investors banking on the Paxos and CreatorFi developments to offset selling pressure.
Market structure reveals extreme oversold conditions across multiple timeframes, with the weekly RSI at 32.9 and monthly RSI at 38.7 both signaling capitulation-level readings. This configuration typically produces sharp reversals, though the December unlock event creates an unusual fundamental headwind that could suppress any recovery attempts until after the supply increase gets absorbed by the market.
Bulls Need Reclaim Above $2.36 to Shift Near-Term Momentum
Recovery requires a decisive close above the 20-day EMA at $2.36, which would mark the first positive technical development in weeks and potentially trigger short covering toward the daily pivot at $2.52. Bulls must leverage the positive stablecoin developments as catalysts, with the Paxos USDG0 launch and CreatorFi’s credit platform potentially drawing new capital into the ecosystem despite unlock concerns.
Bearish continuation triggers if price breaks below the $1.82 monthly low on volume, opening an air pocket toward the $1.50 monthly S2 pivot where no historical support exists. This scenario would likely materialize if unlock fears intensify or broader crypto market weakness emerges, trapping recent buyers who entered on the stablecoin news and forcing liquidations toward uncharted territory.
Given the extreme oversold readings across timeframes and historical precedent for reversals from these levels, the most probable near-term path sees APT attempting a relief bounce toward $2.25-$2.36 resistance before the unlock event creates renewed selling pressure. The contrarian setup favors nimble traders who can capture oversold bounces while respecting that the larger trend remains decisively bearish until proven otherwise.