Ethereum Darts Through $2,800 as Institutional Flows Meet Technical Support

Market Structure Shifts Higher
- ETH reclaims crucial $2,800 level after testing six-month lows, with banks turning to Ethereum for stablecoin settlement activity
- Momentum indicators flash oversold bounce signals while trend strength builds from compressed levels
- Bulls defend multiple support layers between $2,531 and $2,590, but face resistance stack near $3,000
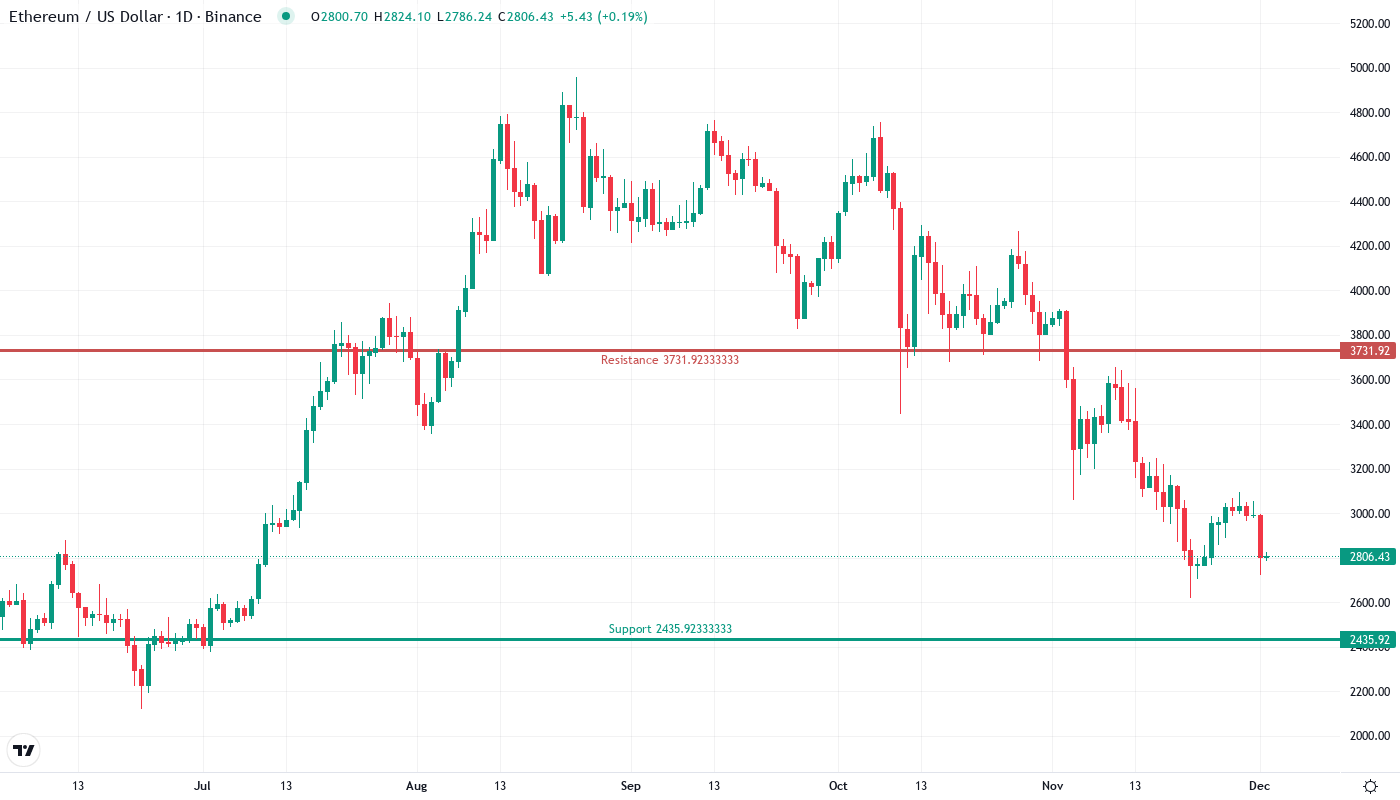
Ethereum surged 5% this week to $2,806.63, recovering from December’s devastating drop that saw the second-largest cryptocurrency shed 27.6% in a month. The move higher comes as major banks increasingly turn to Ethereum for stablecoin and settlement infrastructure, providing fundamental support just as price tested critical technical floors. The main question for traders is: can this institutional-driven bounce transform into a sustainable trend reversal after ETH lost 35% over three months?
| Metric | Value |
|---|---|
| Asset | ETHEREUM (ETH) |
| Current Price | $2806.63 |
| Weekly Performance | -4.96% |
| Monthly Performance | -27.56% |
| RSI (Relative Strength Index) | 33.6 |
| ADX (Average Directional Index) | 43.2 |
| MACD (MACD Level) | -163.02 |
| CCI (Commodity Channel Index, 20-period) | -101.30 |
Oversold RSI at 33.58 Signals Capitulation Phase Complete
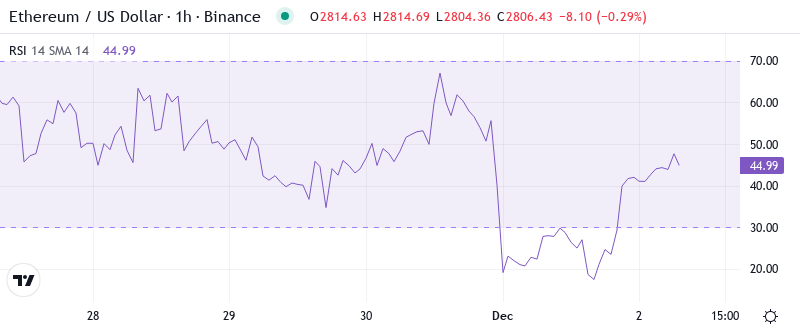
RSI sits at 33.58 on the daily timeframe, marking the first oversold reading since August’s washout that preceded a 40% rally. This momentum exhaustion arrives precisely as institutional adoption headlines hit the wires – BlackRock executives advocating for tokenization expansion while banks migrate settlement activity to Ethereum’s network. The confluence suggests sellers may have overextended into positive fundamental developments.
Similar RSI configurations in September and November sparked relief rallies of 25-30% within weeks, though both ultimately failed at the 50-day EMA. So for swing traders, this balanced oversold bounce means quick profits are available, but position sizing should reflect the broader downtrend context until price reclaims key moving averages. The weekly RSI at 40.36 hasn’t quite reached extreme oversold territory, suggesting more work remains for a major bottom.
ADX Climbs to 43.24 – Mature Downtrend Nearing Exhaustion
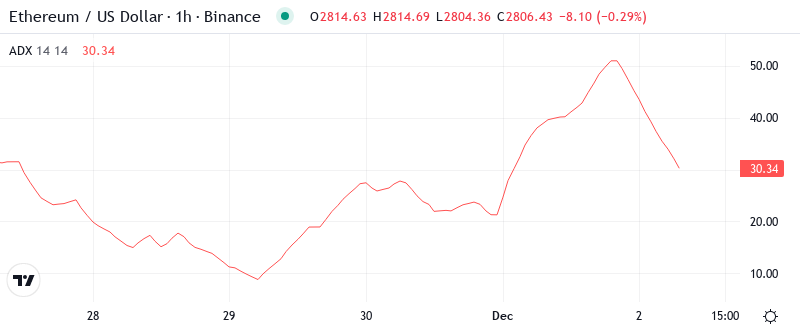
At the level of 43.24, the ADX entry indicates that the downtrend has reached mature stages where exhaustion typically emerges. Basically, being in this zone above 40 means the selling pressure has been intense and directional, but historical patterns show such extreme readings often precede trend reversals or at least meaningful bounces. The Federal Reserve’s $13.5 billion injection into U.S. banks adds liquidity to the system, potentially dampening crypto selling pressure.
To clarify, the ADX is indicating we’re transitioning from intense trending conditions to a potential reversal setup. Therefore, day traders should adjust their strategies for increased volatility and potential whipsaws as the market digests both the oversold bounce and institutional adoption news. Watch for ADX to peak and roll over – that would confirm trend exhaustion and open the door for sustained recovery.
Price Trapped Below Entire EMA Cloud Since December
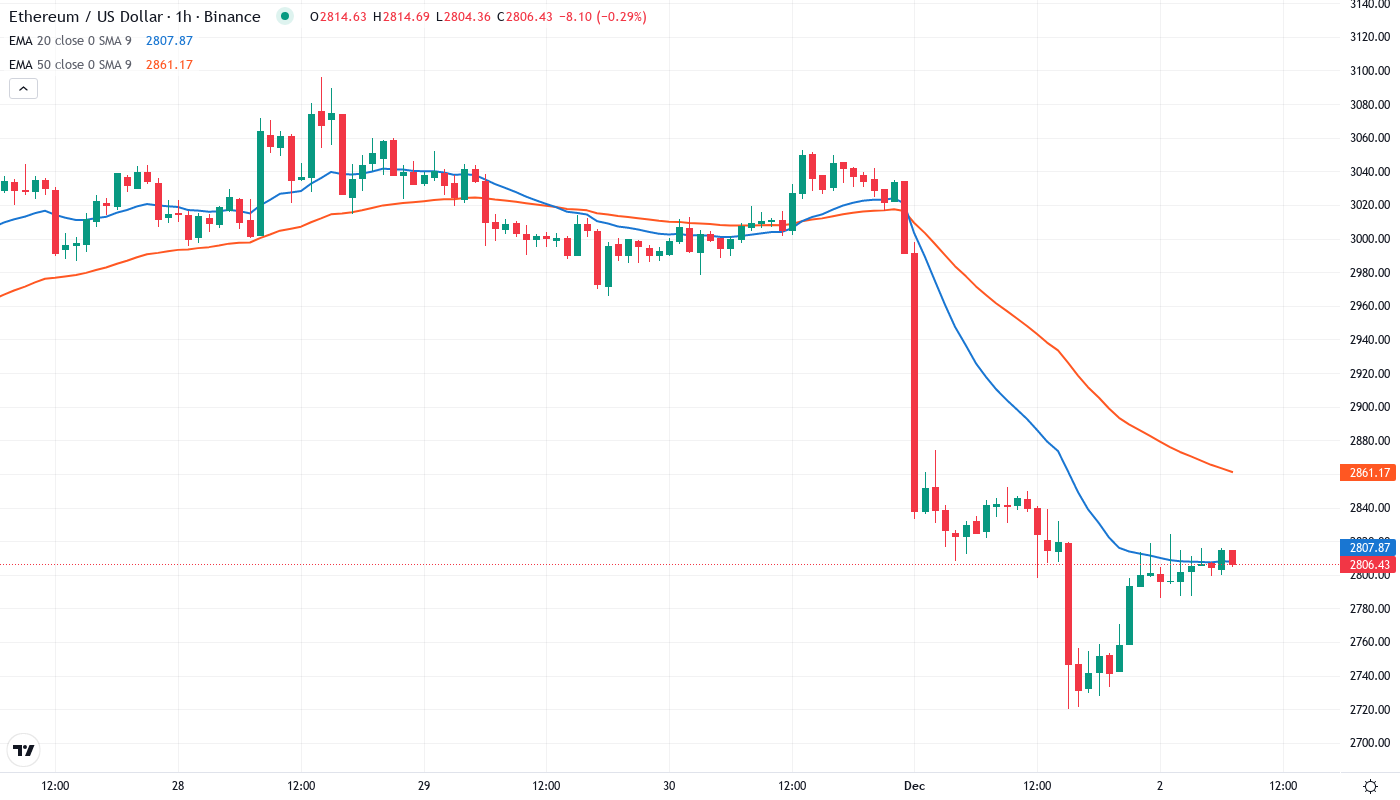
Looking at the moving average structure reveals the technical damage from December’s collapse. ETH currently trades below all major EMAs – the 10-day at $2,930, 20-day at $3,036, and critically, the 50-day EMA at $3,368. This stacked resistance creates a formidable barrier for any recovery attempt, though the institutional flows story provides potential catalyst for reclaiming these levels.
What’s significant is the compression between the 10-day and 20-day EMAs, with only $106 separating them. This tight configuration often precedes explosive moves as trapped shorts cover into any strength. The 50-day EMA at $3,368 represents the key level to flip – that former support area now transforms into a red line for the bulls to conquer. Only a decisive close above would shift the intermediate trend from bearish to neutral.
Resistance Stacks Heavy Between $3,000 and $3,368
Above current price, sellers have stacked multiple resistance layers that coincide with psychological levels and moving averages. The immediate resistance sits at $3,000 – a round number that rejected advances three times in December’s decline. Beyond that, the 20-day EMA at $3,036 and monthly pivot at $3,176 create a resistance cluster that requires significant volume to overcome, though increased institutional activity could provide that fuel.
Bulls defend multiple support layers between $2,531 (200-day EMA) and $2,590 (December low). The $2,531 level has particular significance as it represents both long-term trend support and matches the 200-week moving average on higher timeframes. Banks turning to Ethereum for settlement infrastructure adds fundamental backing to these technical floors.
This configuration resembles a compressed spring between solid support and overhead resistance. The structure signals buyers’ power as long as they keep $2,531 intact on any retracement. The tightening range between $2,531 and $3,000 won’t hold indefinitely – institutional flows and Fed liquidity suggest resolution favors the upside, but confirmation requires volume.
Bulls Need Close Above $3,036 to Confirm Recovery
Should price reclaim the 20-day EMA at $3,036 with conviction, the path opens toward $3,368 (50-day EMA) as institutional adoption provides ongoing catalysts. The combination of oversold bounce, banks embracing Ethereum for settlements, and BlackRock’s tokenization push creates a favorable backdrop for recovery attempts.
The setup fails if ETH hard rejects at $3,000 and breaks below $2,531 on volume – this would trap recent buyers who entered on institutional adoption news, likely triggering cascading stops toward $2,274 (monthly S1). Such a move would negate the oversold bounce thesis and suggest deeper structural issues despite positive fundamentals.
Given the technical configuration and institutional tailwinds, the most probable near-term path is consolidation between $2,531-$3,000 while the market digests both the oversold conditions and adoption developments. Watch for decreasing ADX and rising RSI as signs the downtrend exhaustion process continues before the next directional move.