Ethereum Momentum Exhaustion Signals Potential Floor as Institutional Flows Build

Market Structure Shifts Lower
- ETH trades 27.5% below monthly highs after brutal December correction
- Institutional inflows exceed $1B weekly despite technical weakness
- RSI approaches oversold territory for first time since August washout
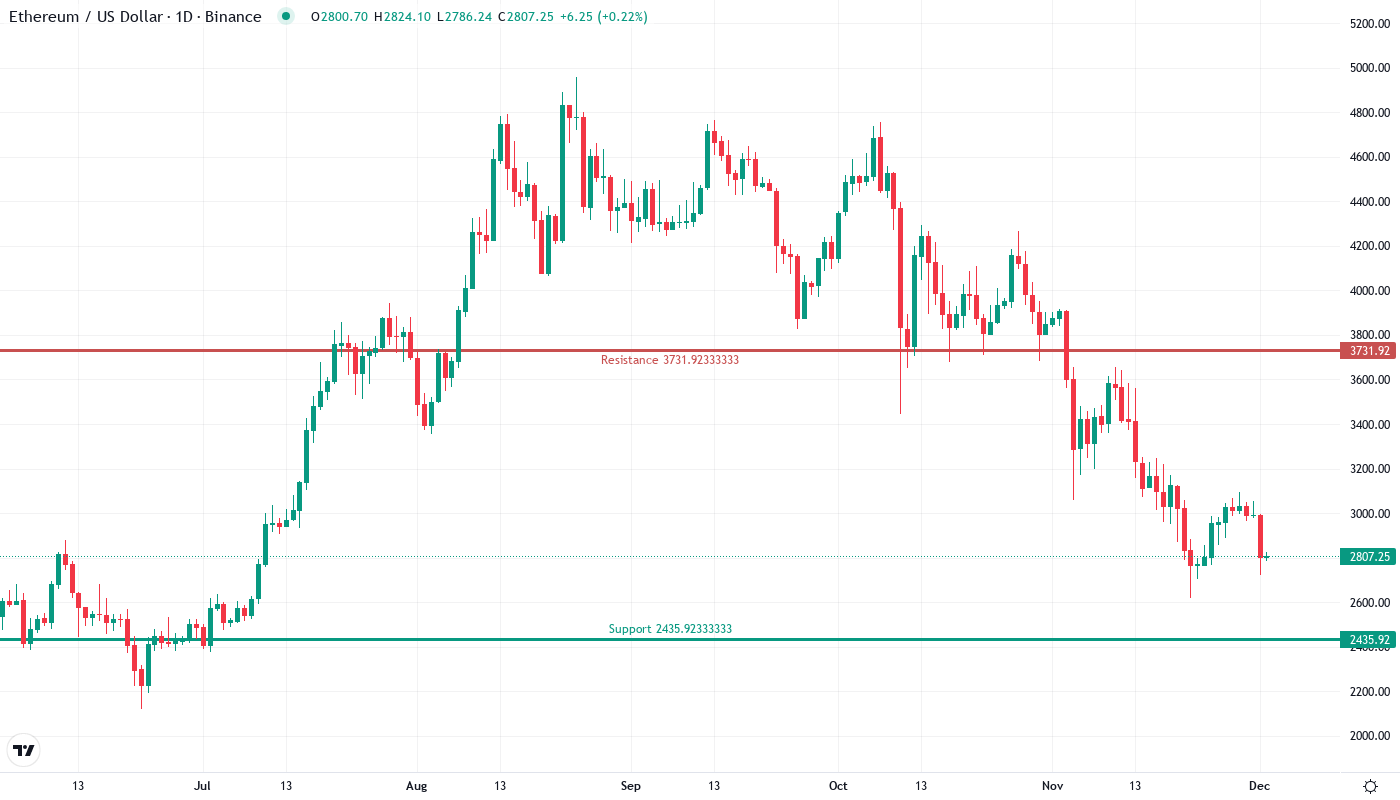
Ethereum’s price action tells a story of exhaustion meeting institutional support. The second-largest cryptocurrency shed $1,106 from December’s $3,913 peak to current levels around $2,808 – a devastating 27.5% monthly decline that ranks among the steepest corrections this year. Despite the technical damage, digital asset funds reported over $1 billion in weekly inflows with Ethereum capturing a significant portion alongside Bitcoin, while Fidelity’s blockchain fund exploded past $250 million using ETH for settlements. The main question for traders is: does institutional accumulation trump technical weakness, or will the charts dictate another leg lower before buyers truly emerge?
| Metric | Value |
|---|---|
| Asset | ETHEREUM (ETH) |
| Current Price | $2807.69 |
| Weekly Performance | -4.92% |
| Monthly Performance | -27.54% |
| RSI (Relative Strength Index) | 33.7 |
| ADX (Average Directional Index) | 43.2 |
| MACD (MACD Level) | -162.94 |
| CCI (Commodity Channel Index, 20-period) | -101.13 |
RSI Drops to 43.96 – First Sub-45 Reading Since August Bottom
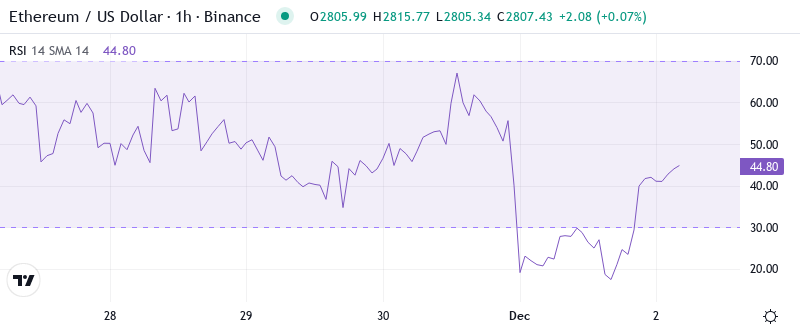
Momentum indicators flash capitulation signals that historically marked significant lows. RSI sits at 43.96 on the daily timeframe, piercing below the neutral 50 level and approaching oversold conditions not seen since August’s washout below $2,300. That August configuration preceded a 70% rally over the following three months, though past performance never guarantees future results.
What’s revealing is how RSI behaved during the decline – no divergences formed on the way down, confirming genuine selling pressure rather than temporary profit-taking. The weekly RSI at 49.50 shows the longer timeframe remains far from exhausted, suggesting any bounce might face resistance before establishing a sustainable trend reversal. So for swing traders, this balanced weekly RSI means rallies toward $3,200 could attract fresh sellers until daily momentum repairs itself above 50.
ADX at 43.23 Confirms Mature Downtrend Nearing Exhaustion
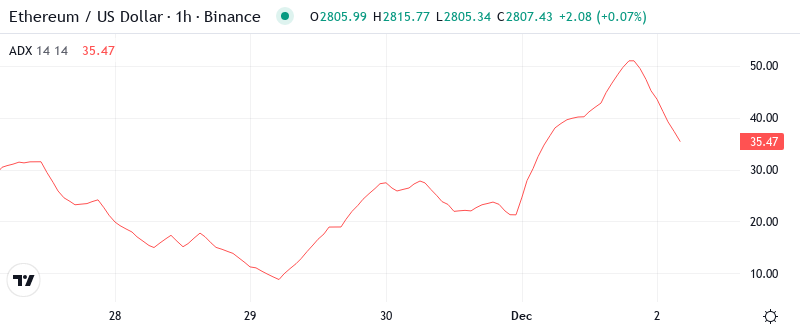
Trend strength readings paint a picture of maximum bearish momentum that often marks climactic moves. At the level of 43.23, the ADX entry indicates the downtrend reached extreme velocity – readings above 40 typically signal trends approaching exhaustion rather than continuation. Basically, when ADX climbs this high, smart money starts looking for reversals rather than chasing the move lower.
Historical patterns show ETH rarely sustains ADX readings above 40 for extended periods. Similar extremes in March and June 2024 marked significant bottoms within days of peak ADX values. To clarify, the ADX is indicating we’ve switched from steady decline to potential reversal conditions. Therefore, contrarian traders should prepare strategies for a momentum shift while respecting that high ADX can persist briefly before trends actually reverse.
20-Day EMA at $3,036 Becomes First Major Resistance Target
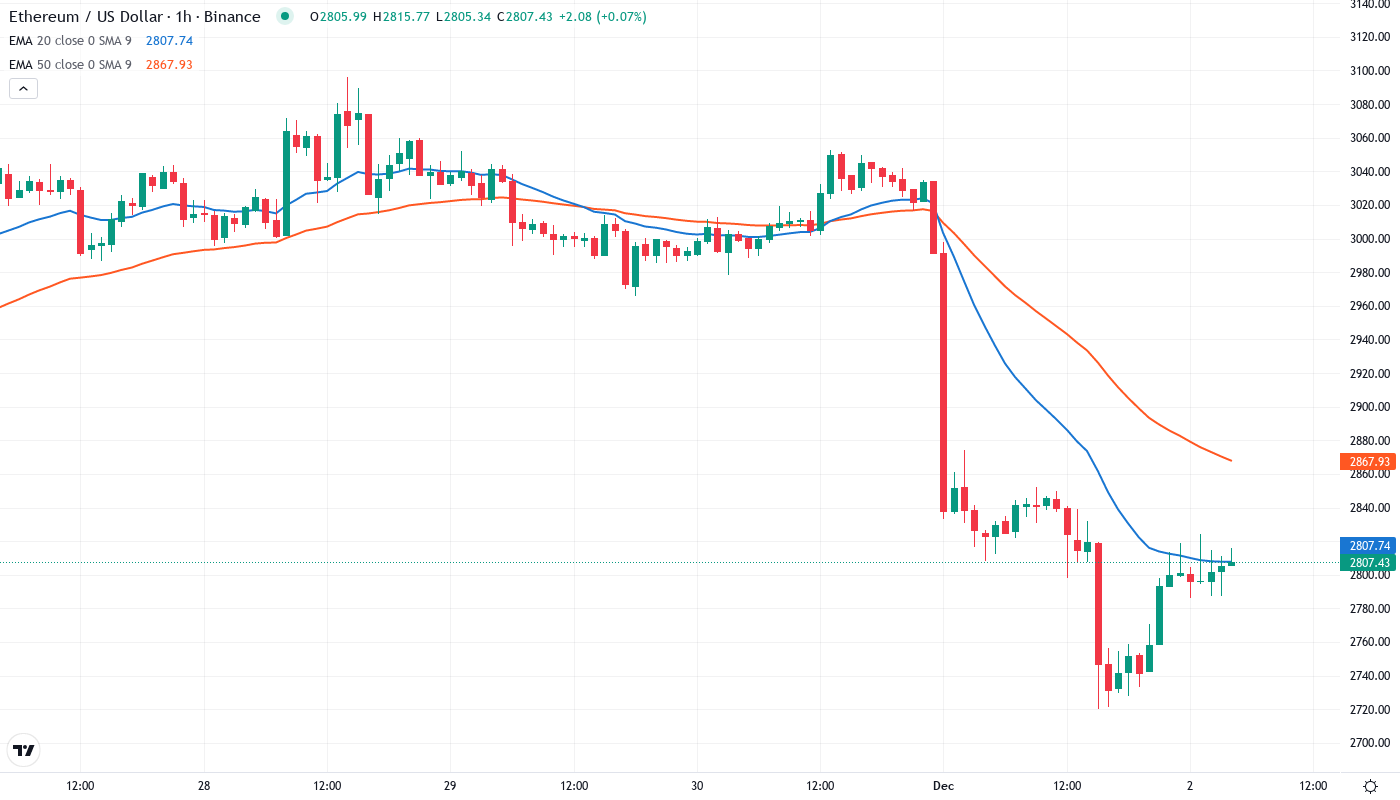
Moving average structure reveals the technical damage inflicted during December’s selloff. Price trades decisively below the entire EMA ribbon – the 10-day ($2,931), 20-day ($3,037), and critically, the 50-day EMA at $3,161. Each average that previously supported rallies now caps potential recoveries, creating a stacked resistance zone between $2,931 and $3,161. Most telling is the compression between current price and the 100-day EMA at $3,369 – a 20% gap that represents significant overhead supply. The 50-day EMA changed from being a support level to resistance after December’s breakdown, rejecting rally attempts three times in the past two weeks. That former support at $3,161 now transforms into a red line for bulls to reclaim on any sustainable recovery. Meanwhile, the 200-day EMA provides distant safety net support near $3,572, though reaching that level would require another 27% decline from current prices.
Bithumb Suspension Creates $2,600-$2,800 Liquidity Vacuum
Resistance stacks heavy between the psychological $3,000 level and December’s breakdown point at $3,200. The immediate resistance sits at $2,931 where the 10-day EMA converges with recent rejection levels. Above that, sellers defend the critical $3,037-$3,161 zone where the 20-day and 50-day EMAs cluster with multiple failed rally attempts. The Bithumb exchange suspension of Ethereum deposits and withdrawals removed a key liquidity source, potentially exacerbating volatility in both directions.
Bulls now guard the $2,600-$2,800 support zone that held through six tests since late December. The monthly low at $2,620 marks the absolute floor, with volume profiles showing heavy accumulation between $2,650-$2,700. Liquidation data reveals $389 million in futures positions wiped out during the recent squeeze, clearing weak longs and potentially creating a cleaner support base.
Market structure suggests a potential double bottom formation if $2,620 holds on any retest. The distance between current price and major moving averages creates unusual compression – historically, such gaps resolve through either violent snapback rallies or final capitulation moves. Institutional flows continuing despite technical weakness adds an interesting dynamic where smart money accumulates into retail capitulation.
Bulls Need Daily Close Above $3,000 to Shift Momentum
Bulls require a decisive daily close above the psychological $3,000 level to signal genuine trend reversal rather than dead cat bounce. Breaking through and holding above the 20-day EMA at $3,037 would flip short-term structure bullish and target the 50-day EMA at $3,161. Continued institutional inflows coupled with Fidelity’s blockchain fund momentum could provide the fundamental catalyst for such a move.
Bearish dominoes fall if price rejects hard at $2,931 and breaks below $2,620 on volume. This would trap recent institutional buyers and likely trigger stop-loss cascades toward $2,400 or potentially the 200-week moving average near $2,200. The combination of Bithumb’s trading suspension and futures market instability creates conditions where liquidity gaps could accelerate moves in either direction.
Given current momentum exhaustion signals and institutional accumulation patterns, the most probable near-term scenario sees ETH consolidating between $2,600-$2,900 while digesting December’s decline. Weekly closes above $2,800 would gradually repair technical damage and set up a stronger recovery attempt toward $3,200 by late January, assuming crypto market sentiment stabilizes and no additional exchange disruptions emerge.