Stacks Tests Critical Support as Cross-Chain Integration News Fails to Spark Recovery
Market Structure Shifts Lower
- STX token price fell 21.8% this week to $0.372, dropping below the November opening price.
- Decline follows the broader cryptocurrency market downtrend.
- Another round of Bitcoin redemptions through the STACK sMining project compounds the fall.
The STX token price fell 21.8% this week to $0.372 with the token price now below the November opening price. The decline largely follows the current market downtrend seen across the cryptocurrency space. In the case of STX, this has been compounded by another round of Bitcoin redemptions through the STACK sMining project. As outlined in our previous post, the continued flow of Bitcoin out of the company’s control should push the $0.40 support lower by the equivalent Bitcoin amount each week. This means if the tracked sentiment exhangelevel continues, the floor should reach $0.317 for 3 days and hold.
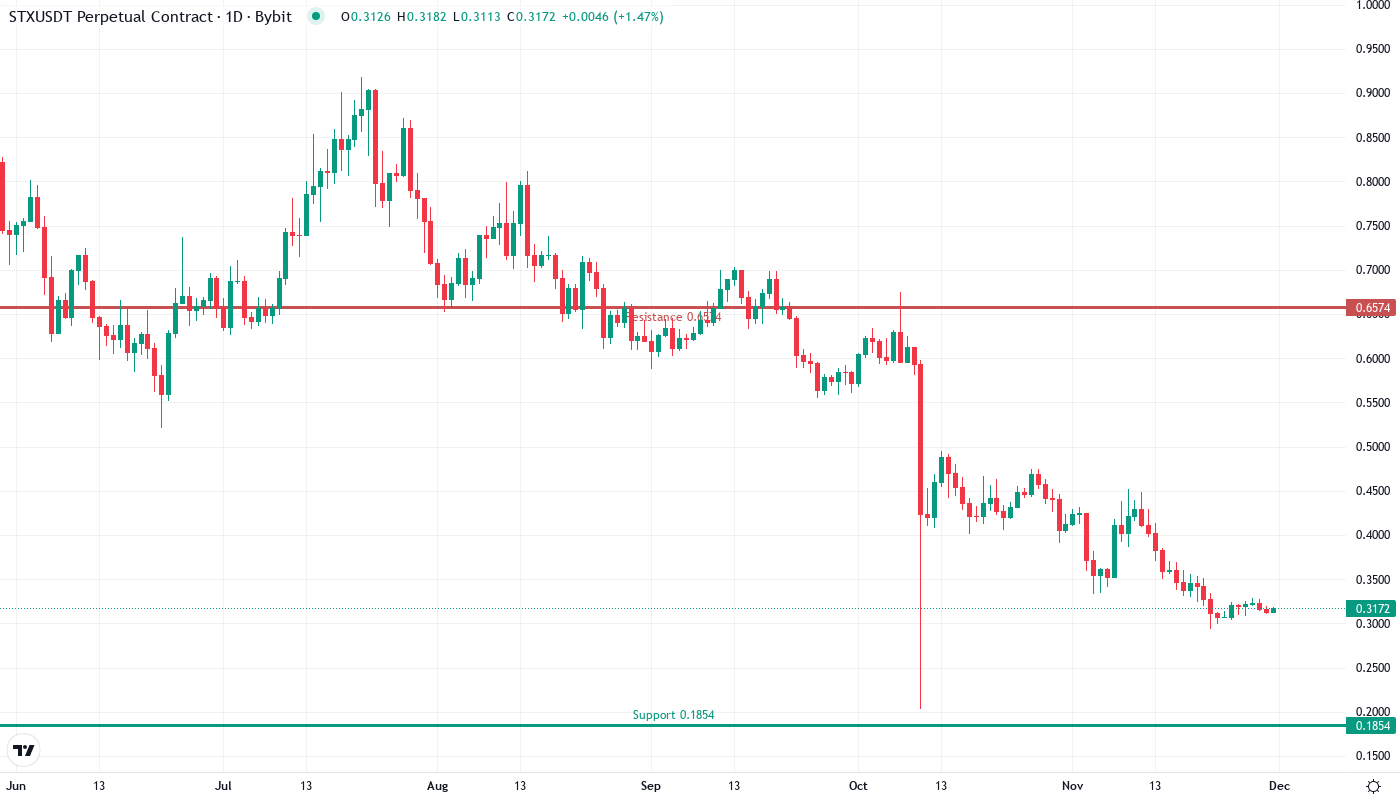
Stacks continues to fall, losing 21.8% for the week and reaching $0.317. The Circle’s news of xReserve support hasn’t had much positive impact to stop the bears. The three-month loss now stands at 48.8% with December being even worse for STX as it just gave up monthly high of $0.45 against the current price. The question is: will $0.317 hold? It has been tested several times in the last couple of days. If not, the price looking for an even lower bottom at around $0.29.
| Metric | Value |
|---|---|
| Asset | STACKS (STX) |
| Current Price | $0.32 |
| Weekly Performance | 3.29% |
| Monthly Performance | -21.82% |
| RSI (Relative Strength Index) | 35.7 |
| ADX (Average Directional Index) | 33.3 |
| MACD (MACD Level) | -0.03 |
| CCI (Commodity Channel Index, 20-period) | -63.93 |
Momentum Exhaustion Signals Potential Bottom After 86% Yearly Decline
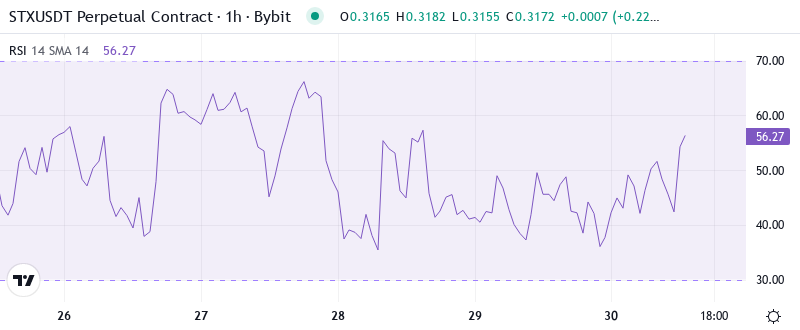
The current RSI stands at 35.73 on the daily timeframe, which is the initial entry into below oversold since the late August washout before a relief rally grew by nearly 40%. It’s simply starting to approach levels where most tend to throw in the selling towel, although not quite to those extreme oversold sub 30 readings of previous major lows.
What is interesting to note is that RSI hardly moved after Circle made its xReserve announcement, news that typically leads to momentum changes in steadier market environments. Thus, for swing traders, this neutral reaction to favorable fundamental news with RSI hanging out in the oversold area is a good old setup – either we are close to a technical relief rally, or the fundamentals are so weak that not even positive ones can stop a downtrend.
ADX at 33.31 Confirms Mature Downtrend Nearing Exhaustion Point
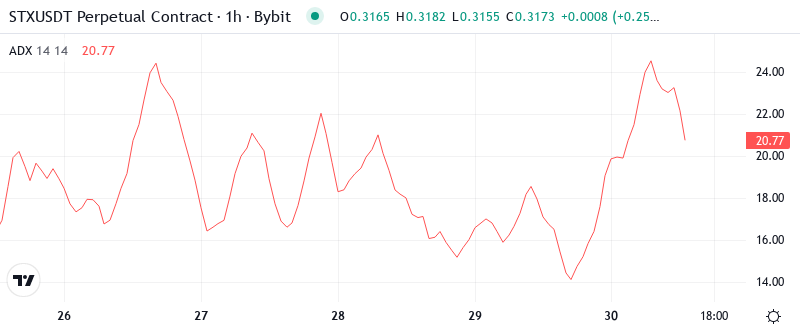
The current ADX reading is at 33.31, suggesting that we are in the midst of a sizable trend that is approaching maturity. This is the zone a trend follower wants but is shy of the extreme readings above 40 that usually mark blow-off bottoms. This is the zone where trend followers have made their money and now insiders are ready to start sniffing out those reversal set-ups.
What is interesting to note is that in downtrends ADX readings above 30 often come in at that final capitulation flush right before you get a big counter-trend rally. So the ADX is telling day traders to respect the trend and that we likely have more downside ahead but to also be ready for that surge of volatility as the trend tires itself out. This isn’t a market to fight the tape on but instead to start planning your next maneuver once this flush plays out.
20-Day EMA at $0.339 Becomes First Resistance Target for Any Recovery
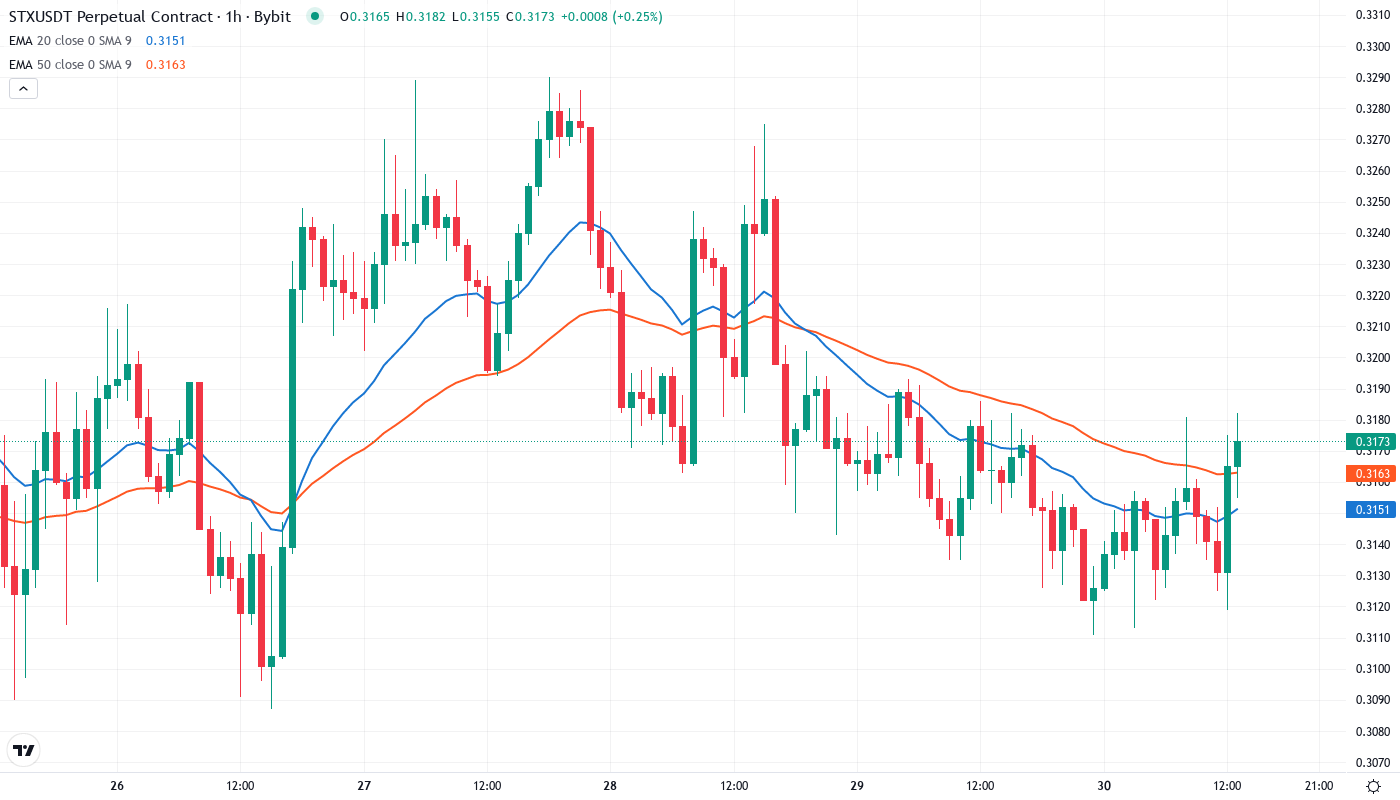
The EMA structure provides guidance for the bulls relocating their courage. The nearest EMA support is the 34-day EMA at $0.316, followed by the 50-day EMA ($0.398). The 200-day EMA at $0.501 offers long-term support.
What is more indicative of the underlying weakness is that the xReserve integration did not spark any meaningful post-proclamation rally suggesting it was largely priced in by the market ergo the build-up mirrors the initial collapse in that traders eyeing $0.25 will simply wait – and continue to impress momentum on Stacks as the dominant seller. The more optimistic $0.40 probably won’t come into play until the end of Q1 2022.
Support Crumbles Below $0.317 While Resistance Stacks Heavy Overhead
The next short-term support is the $0.315 level, where two SMAs (50 – day & 100) converge, followed closely by a key trading range between $0.30 – $0.28, which has held since the COVID-19 meltdown. This represents a 60% drop if breached, leaving bulls at levels from last December, with any longs opened since May (or worse in the $0.45 range) feeling significant pain – assuming they haven’t already thrown in the towel.
The support architecture appears weaker now, with little between spot price and the monthly low beside $0.317 at $0.293. This floor has been stress-tested numerous times over the past few days, yet with every retest, the rebound consolidates – a typical bullish precursor confirming that support becomes resistance – indicating an imminent break. Volume profile indicates little buying interest sub-$0.30 so a break could fast-track us toward the Q3 lows.
The current market structure shows that bulls have a hefty 7.6% cushion to defend while facing a 26% rally just to reach the first major resistance. Such a structure, coupled with the fact that the price failed to sustain higher levels on news of a positive development is indicative of the technical damage not allowing markets to rebound on good news alone.
Recovery Requires Decisive Close Above $0.358 to Shift Momentum
Buyers need to break through resistance at the 30-day exponential moving average and consolidate above $0.358 at the horizontal line of supply. This level acted as robust resistance before the move to $0.50 and could similarly offer solid support if breached.
If we break bearish, Cardano will most likely follow the path of Bitcoin. Its first major support level stands at 62 cents. The second major level of support is at 60 cents. If the price falls through those levels, Cardano may find support around the 50 cents level.
Based on the technical setup and the market’s allergic reaction to any material news, the highest probability near-term trajectory is range-bound consolidation between $0.293-$0.339 as weak hands sell and strong hands digest shares ahead of a more meaningful relief rally going into Q1 2025.