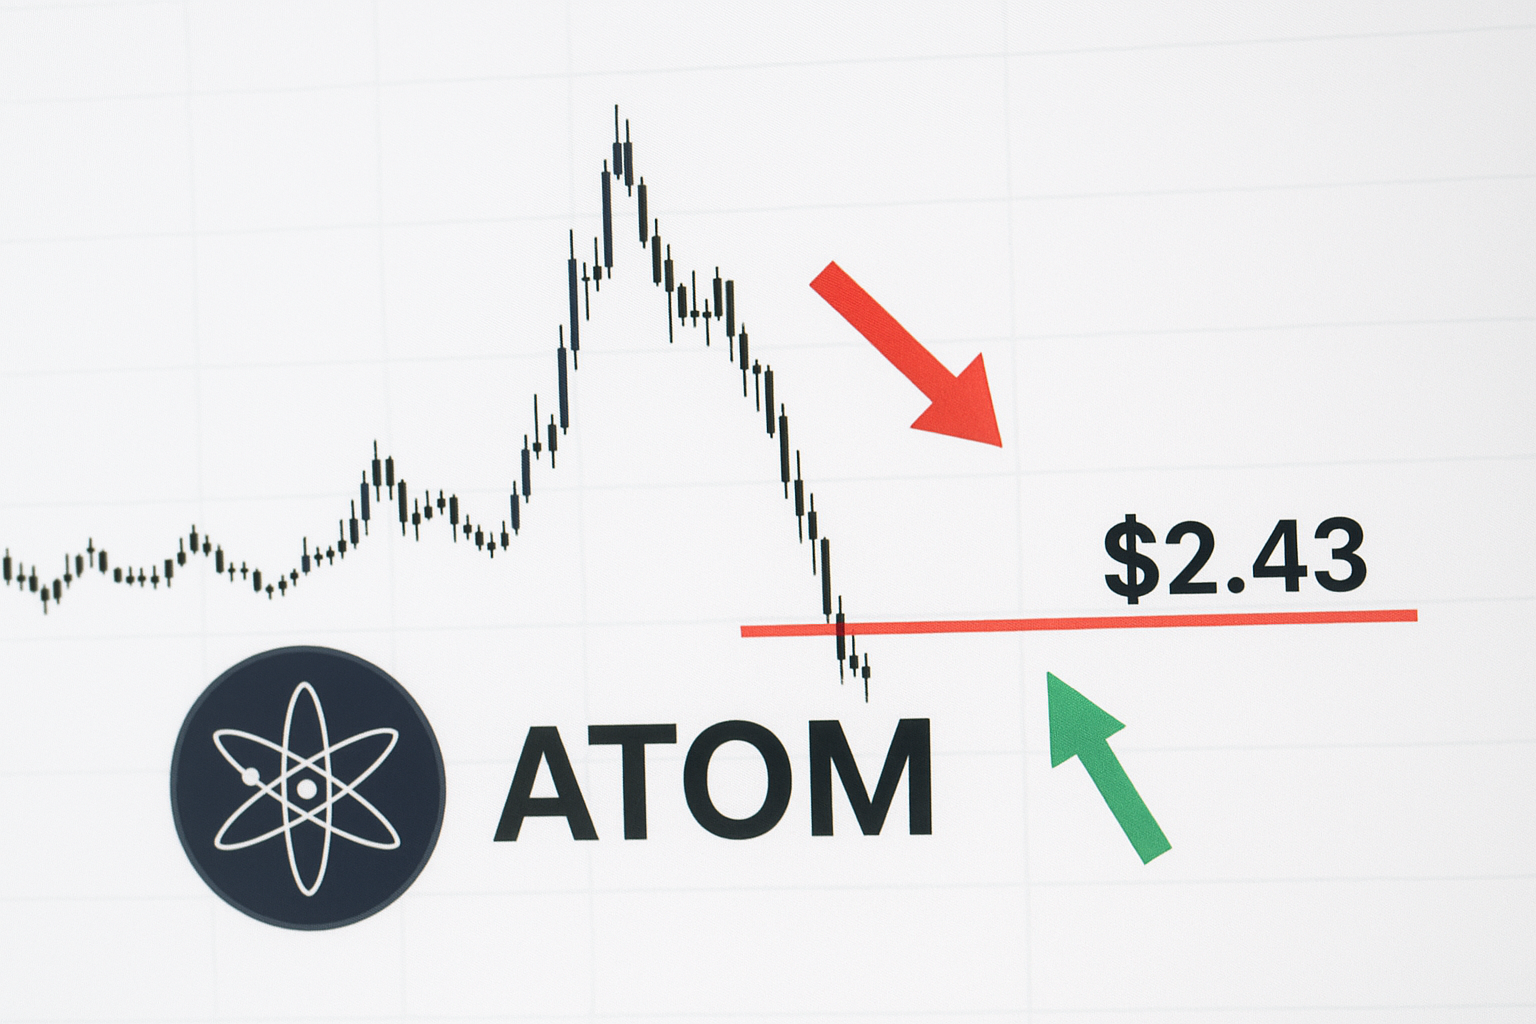
ATOM Tests Critical Support at $2.43 as Tokenomics Overhaul Sparks Debate
Market Structure Shifts Lower
- ATOM trades at $2.43, down 17.6% over the past week as sellers dominate
- Tokenomics redesign proposal creates uncertainty despite long-term potential
- Price tests multi-year lows with RSI approaching oversold territory
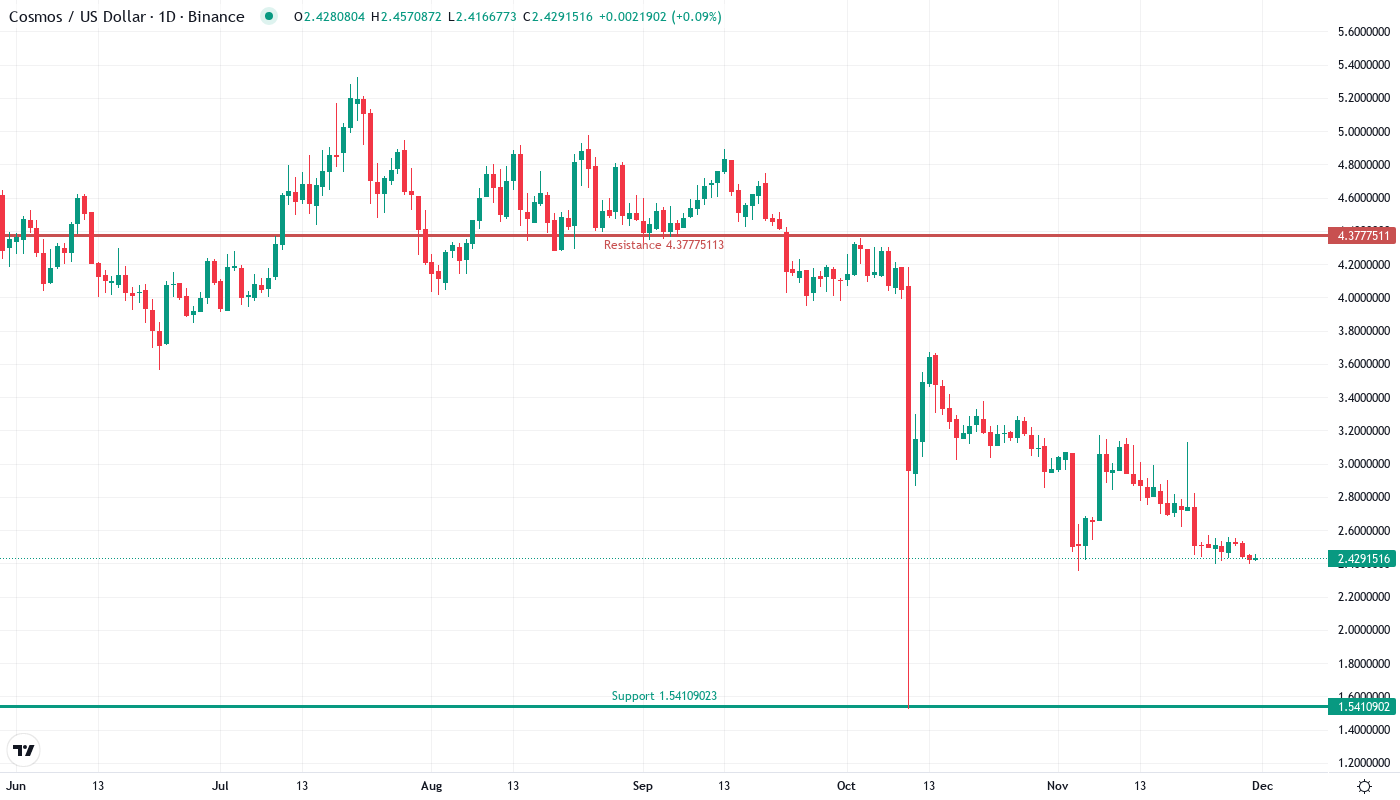
Cosmos (ATOM) has suffered a devastating drop of 17.6% over the past week, tumbling from $2.95 to $2.43 as the market digests proposals for a complete overhaul of ATOM’s tokenomics model. The cryptocurrency now trades at levels not seen since early 2023, with the monthly performance showing an even more brutal 45.5% decline. The main question for traders is: will the proposed tokenomics changes that aim to reward usage over scarcity provide a fundamental catalyst for recovery, or will technical weakness persist as the market sorts through the implications?
| Metric | Value |
|---|---|
| Asset | COSMOS (ATOM) |
| Current Price | $2.43 |
| Weekly Performance | -3.44% |
| Monthly Performance | -17.59% |
| RSI (Relative Strength Index) | 33.2 |
| ADX (Average Directional Index) | 24.3 |
| MACD (MACD Level) | -0.15 |
| CCI (Commodity Channel Index, 20-period) | -88.96 |
Momentum Exhaustion Signals Capitulation Phase Near Completion
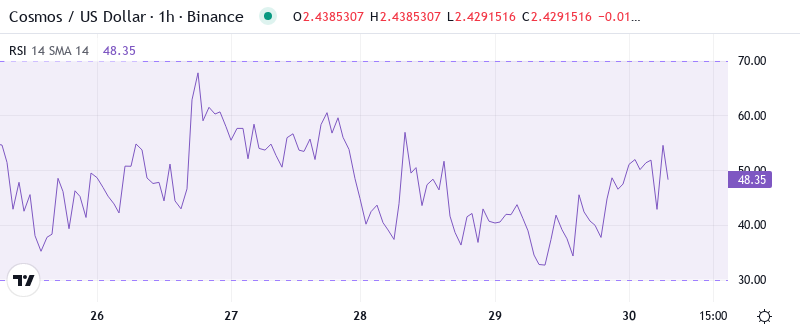
RSI sits at 33.22 on the daily timeframe, marking the first approach to oversold conditions since the August washout that preceded a 40% relief rally. The oscillator’s steady decline from overbought readings above 70 in November tells a clear story of momentum exhaustion, with each bounce growing weaker as sellers maintained control. Basically, the current reading suggests we’re entering the capitulation phase where weak hands flush out, though not quite at the extreme oversold levels below 30 that typically mark major bottoms.
What’s revealing is how RSI behaved during the tokenomics announcement – instead of providing any momentum boost, the news accelerated the decline as uncertainty trumped potential long-term benefits. So for swing traders, this balanced-to-oversold RSI means the risk-reward begins favoring longs, but patience is required as the market hasn’t yet shown signs of momentum reversal. Similar RSI configurations in September preceded multi-week consolidations before any meaningful recovery attempts.
ADX at 24.3 Confirms Bearish Trend Without Extreme Conviction
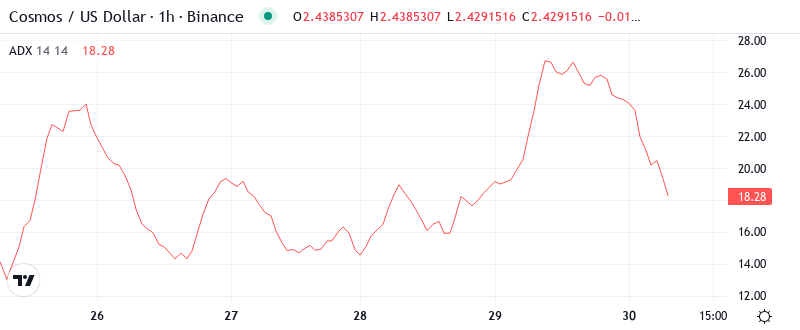
Looking at trend strength, the ADX reading of 24.3 indicates that we’ve shifted from the choppy, directionless action of early December into a defined downtrend, though not yet at extreme levels. The indicator climbed from the low teens over the past two weeks, confirming that the selling pressure has conviction behind it rather than just temporary profit-taking. To clarify, the ADX is indicating that we are switching from boundary conditions to a trending state, with the bearish direction firmly established as long as readings stay above 20.
Since ADX climbed from the mid-teens, the market structure has deteriorated significantly, with each attempt to rally met by aggressive selling. Therefore, day traders should adapt their strategies to this trending environment – fading rallies into resistance rather than trying to catch knives in what ADX confirms as an established downtrend. The silver lining is that ADX at 24.3 leaves room for further acceleration, meaning we haven’t yet hit the extreme readings above 40 that often mark exhaustion points.
20-Day EMA at $2.62 Becomes First Resistance After Support Failure
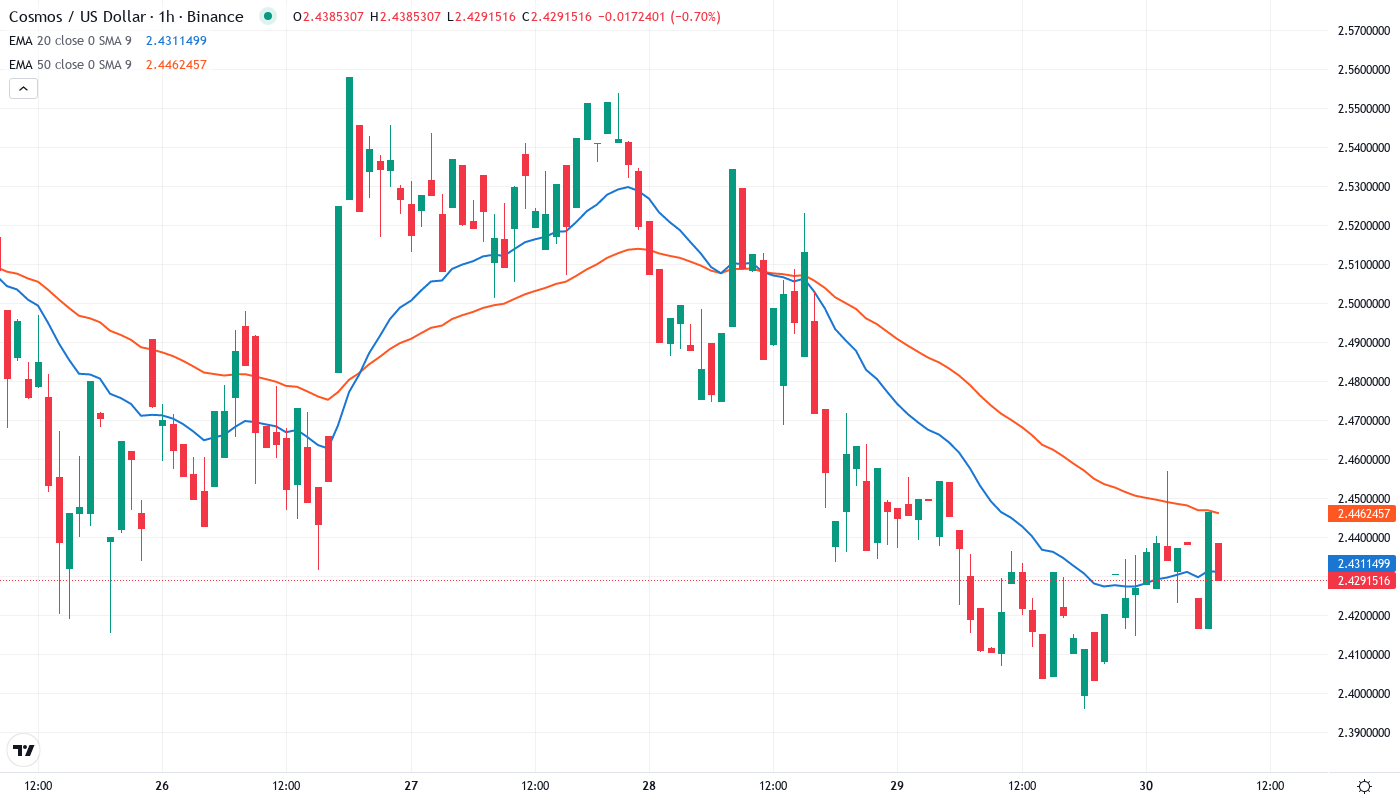
Price action tells a devastating story through the EMA ribbons. ATOM currently trades below the entire moving average stack, with the 10-day EMA at $2.51, 20-day at $2.62, and the critical 50-day EMA at $2.74 all acting as overhead resistance. The 20-day EMA changed from being a support level to a resistance one just as the tokenomics proposal hit the wires, triggering stop-loss cascades as traders who bought the initial news found themselves trapped.
More telling is the compression between the 10-day and 20-day EMAs, now separated by just $0.11 compared to $0.30 two weeks ago. This tightening suggests that any recovery attempt will face immediate selling pressure from underwater positions looking to exit at breakeven. The 50-day EMA at $2.74 now transforms into a red line that bulls must reclaim to shift the narrative from “dead cat bounce” to “potential reversal.” With the 200-day EMA sitting way up at $3.91, the intermediate-term structure remains firmly bearish.
Support at $2.43 Matches Historical Accumulation Zone
The immediate support sits at $2.43, precisely where price currently trades – this level held multiple times throughout 2023’s accumulation phase before the late-year rally. Below that, the next significant floor emerges at $2.17, matching the summer 2023 lows that sparked a 65% recovery rally. Interestingly enough, volume has spiked 18% above the 10-day average at these levels, suggesting some accumulation despite the negative sentiment around the tokenomics uncertainty.
Above current price, sellers have stacked resistance between $2.62 (20-day EMA) and $2.74 (50-day EMA), with the psychological $3.00 level likely acting as a magnet for profit-taking should any relief rally materialize. The monthly pivot at $2.95 adds another layer of resistance, creating a formidable barrier zone that would require sustained buying pressure to overcome.
This configuration resembles a textbook accumulation setup – price testing multi-year support while smart money potentially positions for the long-term benefits of the tokenomics overhaul. The fact that support at $2.43 has attracted buyers six times since June suggests it represents genuine value for patient investors willing to weather the current storm.
Bulls Need Sustained Close Above $2.62 to Shift Momentum
Bulls require a decisive close above the 20-day EMA at $2.62 to signal that the tokenomics uncertainty has been priced in and accumulation is beginning. Such a move would likely target the 50-day EMA at $2.74, with the proposed usage-based rewards system potentially providing the fundamental catalyst for a sustained recovery if implementation details satisfy the market.
The bearish scenario triggers if $2.43 support fails on volume – this would likely flush positions down to $2.17 or potentially the psychologically important $2.00 level. A breakdown here would trap recent buyers who tried to front-run the tokenomics benefits, creating a cascade of liquidations that could push ATOM to multi-year lows despite the long-term potential of the proposed changes.
Given the technical damage and ongoing tokenomics debate, the most probable near-term path sees ATOM consolidating between $2.17-$2.62 while the market digests the implications of rewarding usage over scarcity. This sideways grind would allow the daily RSI to reset from oversold conditions and give the community time to refine the tokenomics proposal before any sustainable rally attempt.