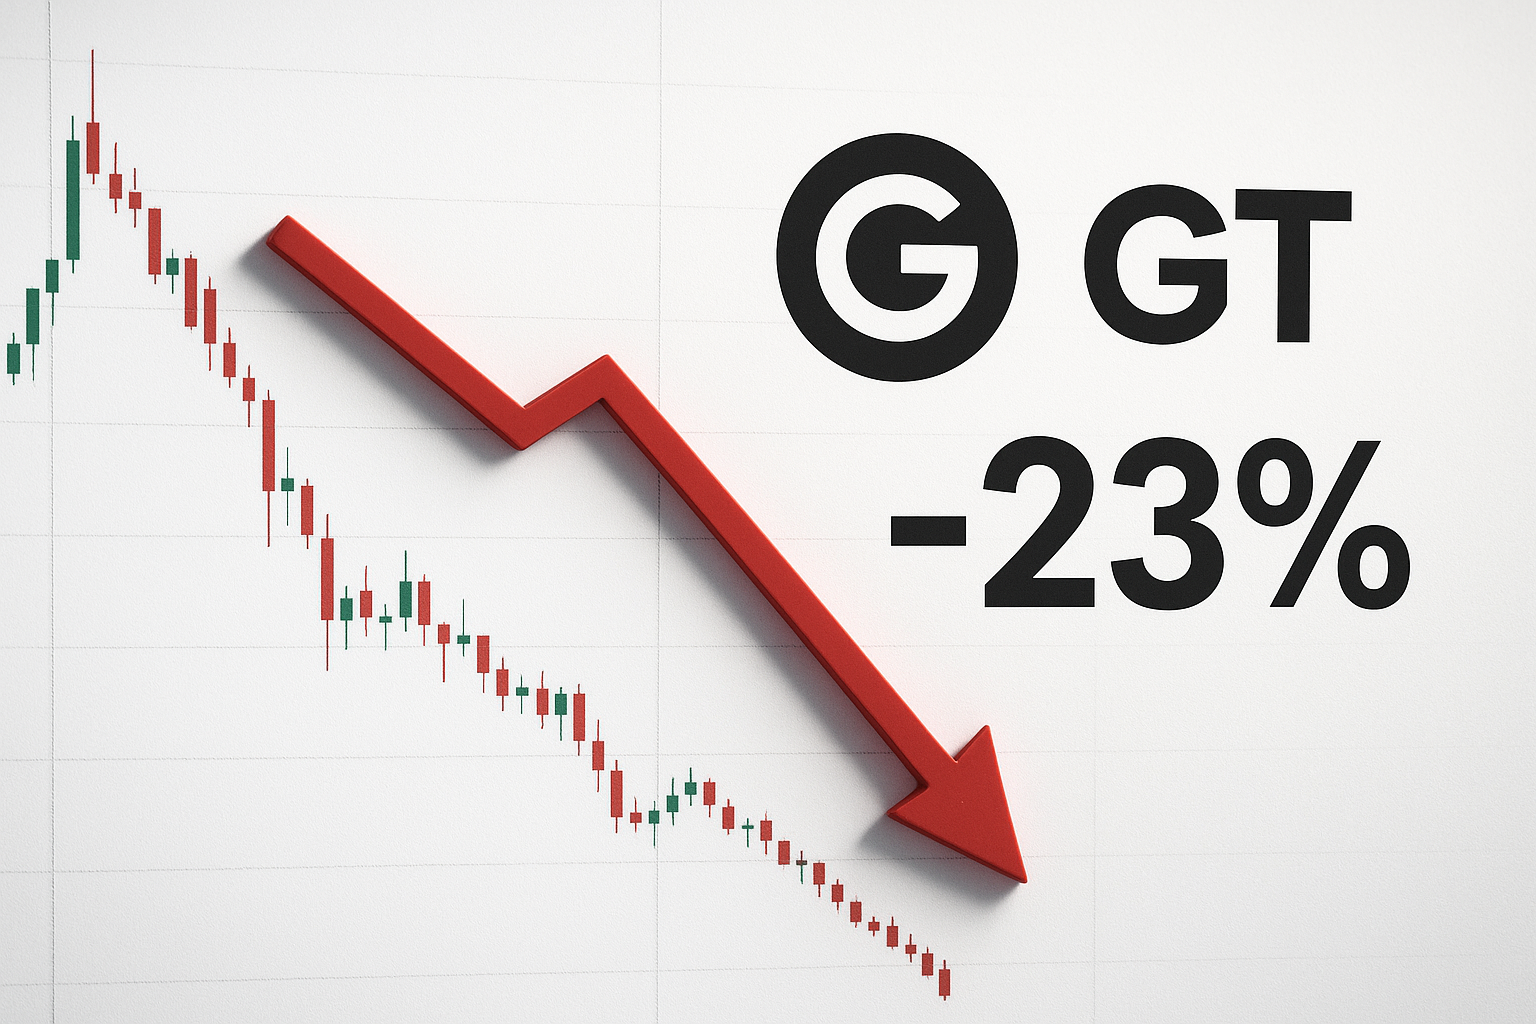
GateToken Darted 23% Lower as Layer 2 Hype Meets Harsh Technical Reality
Market Structure Shifts Lower
- GT plunged 22.79% over the past week despite Layer 2 network announcement
- RSI drops to 44.88 – first neutral reading after extended overbought period
- Bulls defend $10.25 support but face resistance wall at $11.38-$12.40
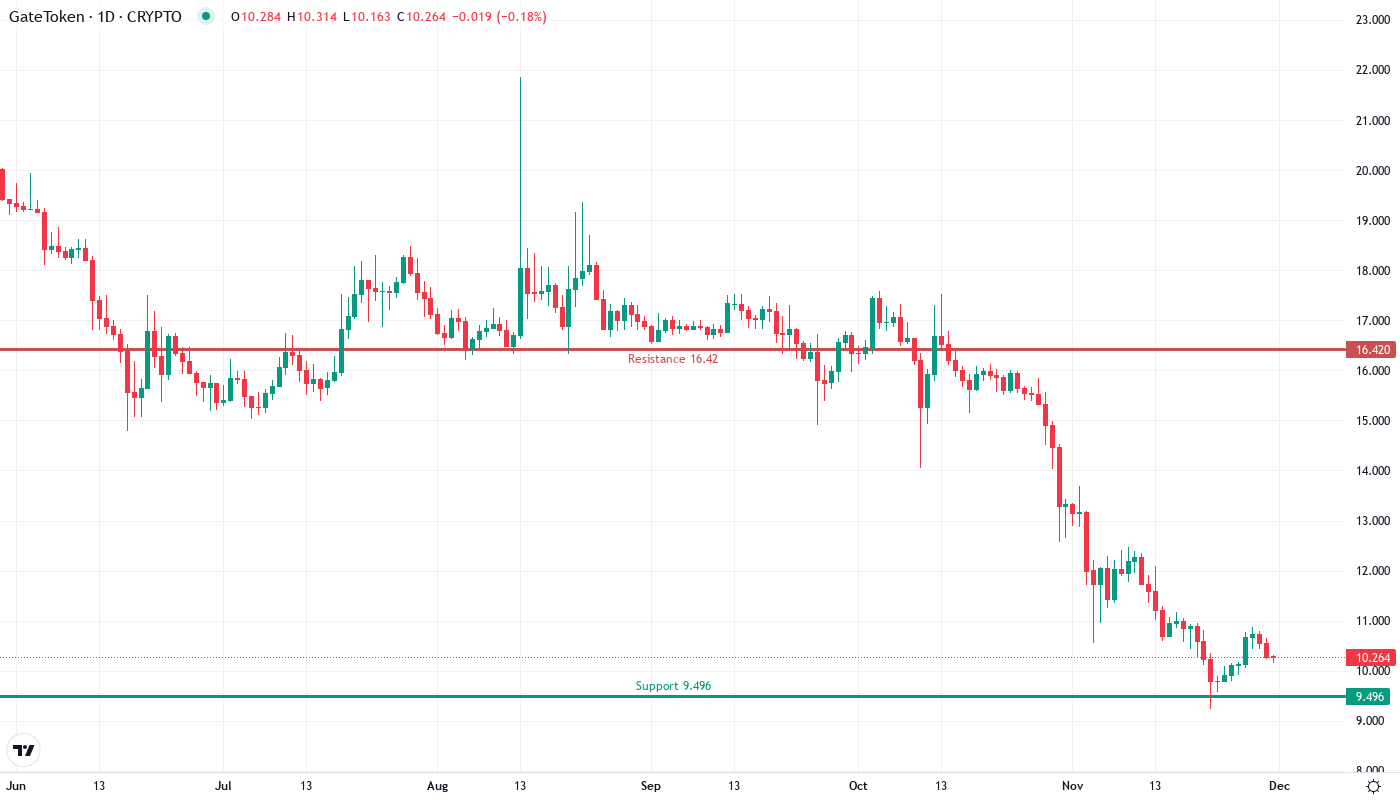
GateToken’s price action tells a sobering story this week, tumbling 22.79% to $10.25 even as Gate announced its Layer 2 network with GT as the exclusive gas token. The devastating drop from last week’s $13.69 high came as traders took profits on the Layer 2 news, triggering a cascade that sliced through multiple support levels. With the token down 39.27% over the past month and 46.66% from three-month highs, the main question for traders is: can the Layer 2 narrative provide enough fundamental support to halt this technical breakdown, or will sellers continue pressing their advantage?
| Metric | Value |
|---|---|
| Asset | GATETOKEN (GT) |
| Current Price | $10.25 |
| Weekly Performance | 4.62% |
| Monthly Performance | -22.79% |
| RSI (Relative Strength Index) | 34.3 |
| ADX (Average Directional Index) | 52.6 |
| MACD (MACD Level) | -0.69 |
| CCI (Commodity Channel Index, 20-period) | -55.52 |
RSI Drops to 44.88 – First Neutral Territory Since Overbought Extremes
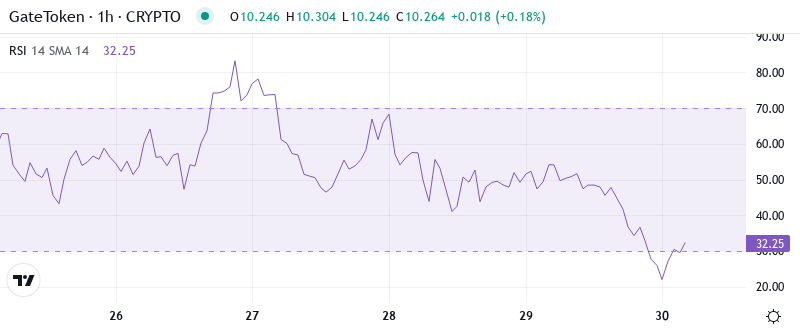
Reading the oscillator at 44.88 on the daily timeframe, traders see momentum finally resetting after weeks of stretched conditions above 70. The sharp descent from overbought territory mirrors the price collapse, but crucially, RSI hasn’t yet reached oversold levels below 30 that typically mark capitulation bottoms. Similar RSI configurations in crypto markets often precede a period of consolidation as neither bulls nor bears hold decisive momentum advantage.
So for swing traders, this balanced RSI means the immediate selling pressure has eased, but there’s still room for further downside before reaching levels that historically attracted bargain hunters. The Layer 2 announcement initially pushed RSI into extreme overbought territory above 77, setting up the conditions for this week’s profit-taking avalanche. It is worth mentioning that the weekly RSI at 59.54 remains in bullish territory, suggesting the longer-term trend isn’t completely broken despite the daily carnage.
ADX at 52.63 Signals Mature Downtrend Nearing Exhaustion Point
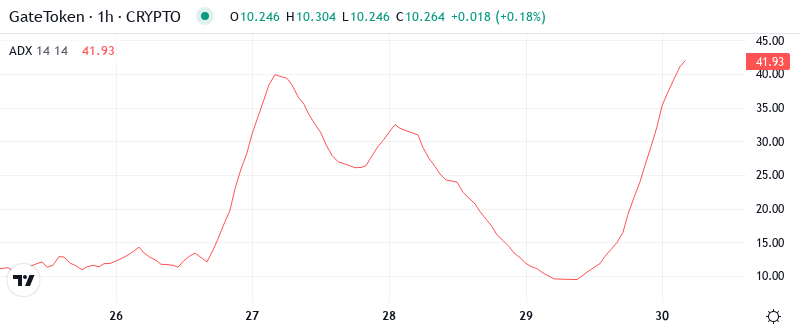
Trend strength readings paint a picture of conviction behind GT’s decline, with ADX climbing to an extreme 52.63 – levels that historically mark trend exhaustion rather than continuation. At this elevated reading, the ADX indicates we’re in the late stages of a powerful directional move. The surge from last week’s 12.31 to current levels represents one of the sharpest ADX accelerations in GT’s recent history, matching the violence of the price breakdown.
What stands out here is how rapidly trend strength built during the selloff, suggesting the Layer 2 news created a “sell the news” dynamic that caught late buyers off-guard. To clarify, when ADX reaches these extreme levels above 50, mean reversion becomes increasingly probable as the fuel driving the trend depletes. Therefore, day traders should prepare for potential volatility compression and range-bound conditions in coming sessions as the market digests this move.
20-Day EMA at $10.82 Becomes First Resistance After Support Failure
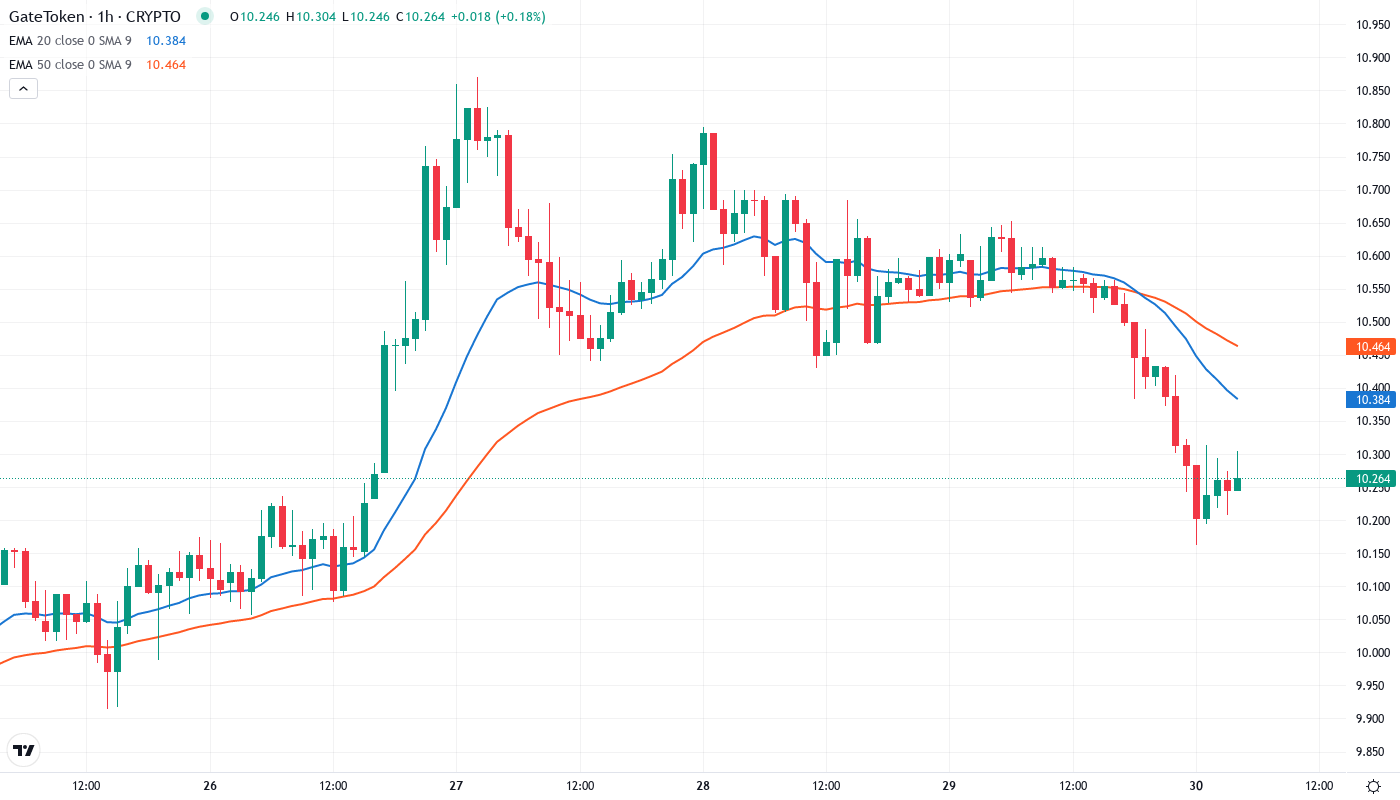
Price action through the EMA ribbons reveals the technical damage inflicted by this week’s selloff. GT currently trades below the entire moving average structure, with the nearest resistance at the 10-day EMA ($10.41), followed by the crucial 20-day EMA at $10.82. The 50-day EMA sits considerably higher at $12.40, marking where the breakdown accelerated after the Layer 2 announcement failed to sustain buying pressure.
Most significant is how the 20-day EMA flipped from support to resistance during Tuesday’s collapse, rejecting recovery attempts as sellers defended this level aggressively. The compression between current price ($10.25) and the 10-day EMA suggests an immediate decision point – either buyers reclaim these short-term averages quickly, or the next leg lower targets the 100-day EMA near $9.81. That former support area at $10.82 now transforms into a red line for bulls to reclaim if they want to signal the selling has exhausted.
Monthly Pivot at $9.08 Anchors Last Defense Before Single Digits
Resistance stacks heavy between $11.38 (30-day EMA) and the psychological $12 level where December’s breakdown began. The monthly R1 pivot at $13.37 now seems distant, sitting just below last week’s $13.69 high that marked the Layer 2 announcement peak. Bulls face multiple resistance layers, making any recovery attempt a grinding affair rather than a sharp reversal.
On the support side, immediate defense sits at the $10 psychological level, with more substantial support at the monthly pivot point of $9.08. This level gains importance as it represents the last barrier before single-digit prices – a psychological threshold that could trigger either capitulation selling or value buying depending on broader market conditions.
The market structure signals seller control as long as price remains below the 20-day EMA at $10.82. The failed Layer 2 pump created a classic “buy the rumor, sell the news” pattern, trapping late entrants who chased the narrative without respecting technical resistance. This configuration resembles a markdown phase where smart money distributes to retail buyers attracted by fundamental developments.
Layer 2 Catalyst Exhausted – Bulls Need Reclaim Above $10.82
Bulls require a decisive daily close above the 20-day EMA at $10.82 to neutralize immediate selling pressure and target the gap fill toward $11.38. Should buyers manage this feat, the 50-day EMA at $12.40 becomes the next major test where the Layer 2 narrative could reignite if accompanied by ecosystem adoption metrics or partnership announcements.
The bearish scenario triggers if GT loses the psychological $10 support on volume, opening a swift move toward the monthly pivot at $9.08. This would likely flush remaining long positions from the Layer 2 announcement rally, potentially creating the capitulation low that sharp reversals often spring from. Below $9.08, the 100-day EMA at $9.81 offers little support before testing single digits.
Given the extreme ADX reading signaling trend exhaustion and RSI resetting to neutral territory, the most probable near-term path sees GT consolidating between $9.50-$11.00 as the market digests the Layer 2 news selloff. The technical damage needs repair time, while the fundamental narrative requires real usage data to reignite buyer interest beyond the initial announcement hype.