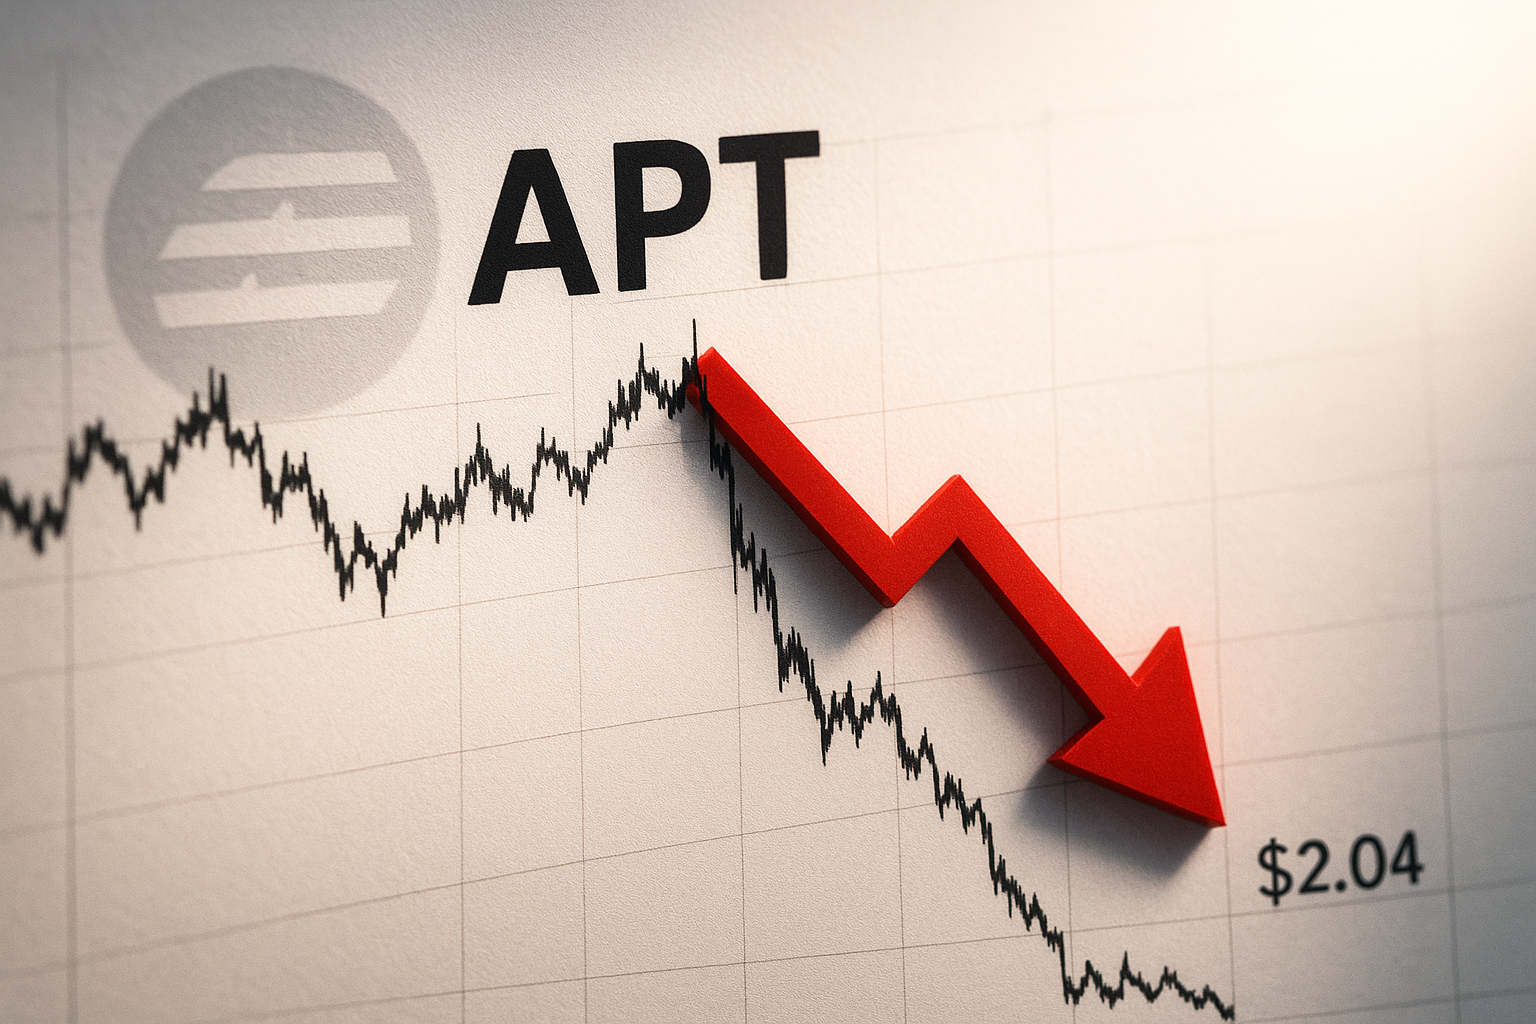
APT Tumbles to $2.04 as Token Unlock Fears Trigger 36% Monthly Collapse
Market Structure Shifts Lower
- The price of APT has decreased by 36.25% in the last month.
- Total tokens unlocked and listed valued at $1.8 billion.
- Price indicators are extremely oversold, matching levels seen in August.
The price of APT has decreased by 36.25% in the last month, and after failing to hold above the $3.43 range high, a lack of demand drove prices lower. The total value of the tokens unlocked and the subsequent listing is said to be $1.8 billion. Reduced demand has created the need for sellers. Price indicators are extremely oversold and are starting to match the levels of despair seen in August.
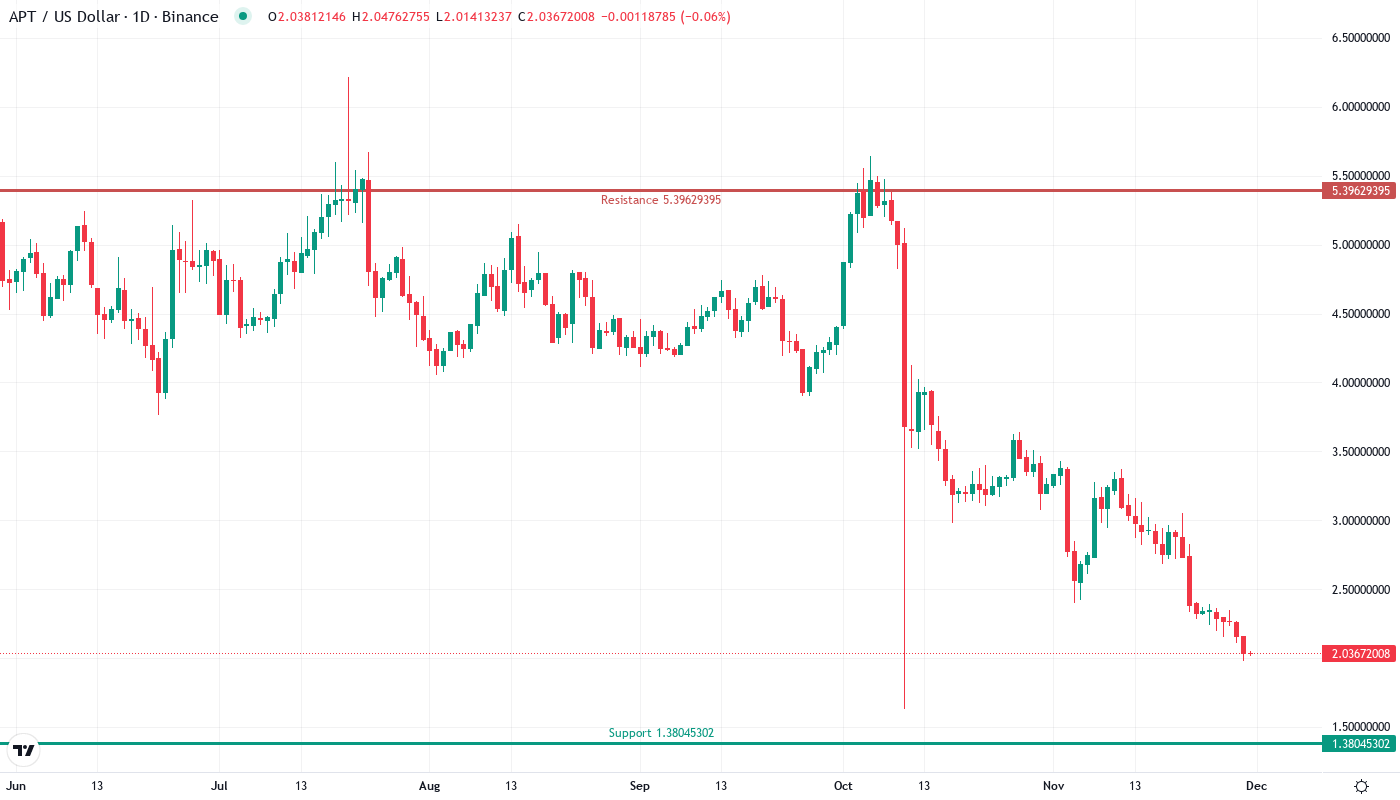
Aptos has entered bear market conditions, as it lost 36.25% over the past month and is now trading at $2.04 – well below December’s peak of $3.43, which represents a loss of around $1.39 per token. Selling intensified following the announcement of a whopping $1.8B token unlock set to occur in December 2025. This is viewed as early distribution, with many token holders seeking to offload their positions before the impending flood of available tokens. The critical question facing investors and traders today is whether APT has put in a bottom at current levels or if the unlock-induced overhead supply could push price down toward $1.50 support.
| Metric | Value |
|---|---|
| Asset | APTOS (APT) |
| Current Price | $2.04 |
| Weekly Performance | -12.26% |
| Monthly Performance | -36.25% |
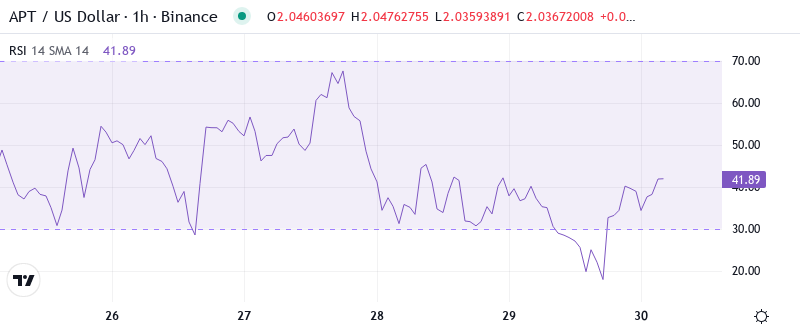
| RSI (Relative Strength Index) | 24.9 |
| ADX (Average Directional Index) | 43.7 |
| MACD (MACD Level) | -0.29 |
| CCI (Commodity Channel Index, 20-period) | -111.36 |
RSI Plunges to 24.93 – Deepest Oversold Reading Since Project Launch
With the market flush with panic selling and no technical damage beneath $65 it’s a potent setup for shorts to cover and for value investors to enter. DEX offering steady bids in the mid-$70s is already beginning to underpin, with the 200-day at $97.23 providing resistance for any preliminary recovery.
What is interesting to note is that RSI hardly moved even after the recovery yesterday, with a reading of 32.99 on the weekly chart. The daily RSI reaching oversold conditions while the weekly RSI remains relatively healthy highlights the significant disconnect between short-term panic and long-term selling exhaustion. As swing traders however, with the market in this tenuous position, it makes sense to look for daily RSI to reset back above 30 before becoming aggressive with bids.
ADX at 43.68 Confirms Powerful Downtrend Still Accelerating
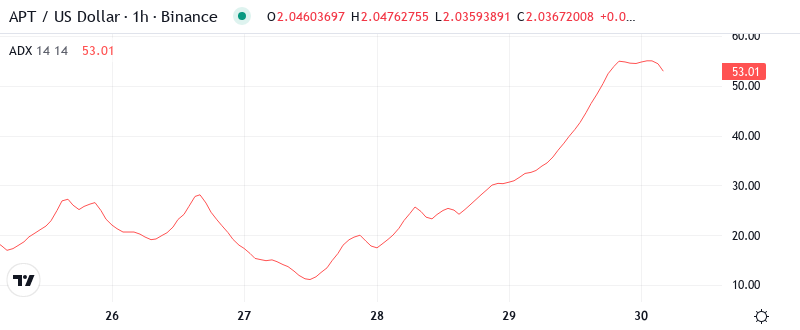
The strength of the trend indicates that it is one of the strongest directional moves in history. This level of trend conviction would usually be seen during a liquidation cascade, and that is what is occurring here as the December unlock news triggered systematic selling across all timeframes. Simply put, when ADX is above 40, markets make incredibly efficient one-way moves.
More significant is the contraction between price and trend strength. While APT dropped 36% in four weeks ADX has increased from 31 points to its current level, a sign that selling pressure is increasing rather than decreasing. As a result, day traders should adjust their approach to higher volatility and not yet to bottom fish, but to trade bounces within the current downtrend while awaiting ADX to drop to less than 25.
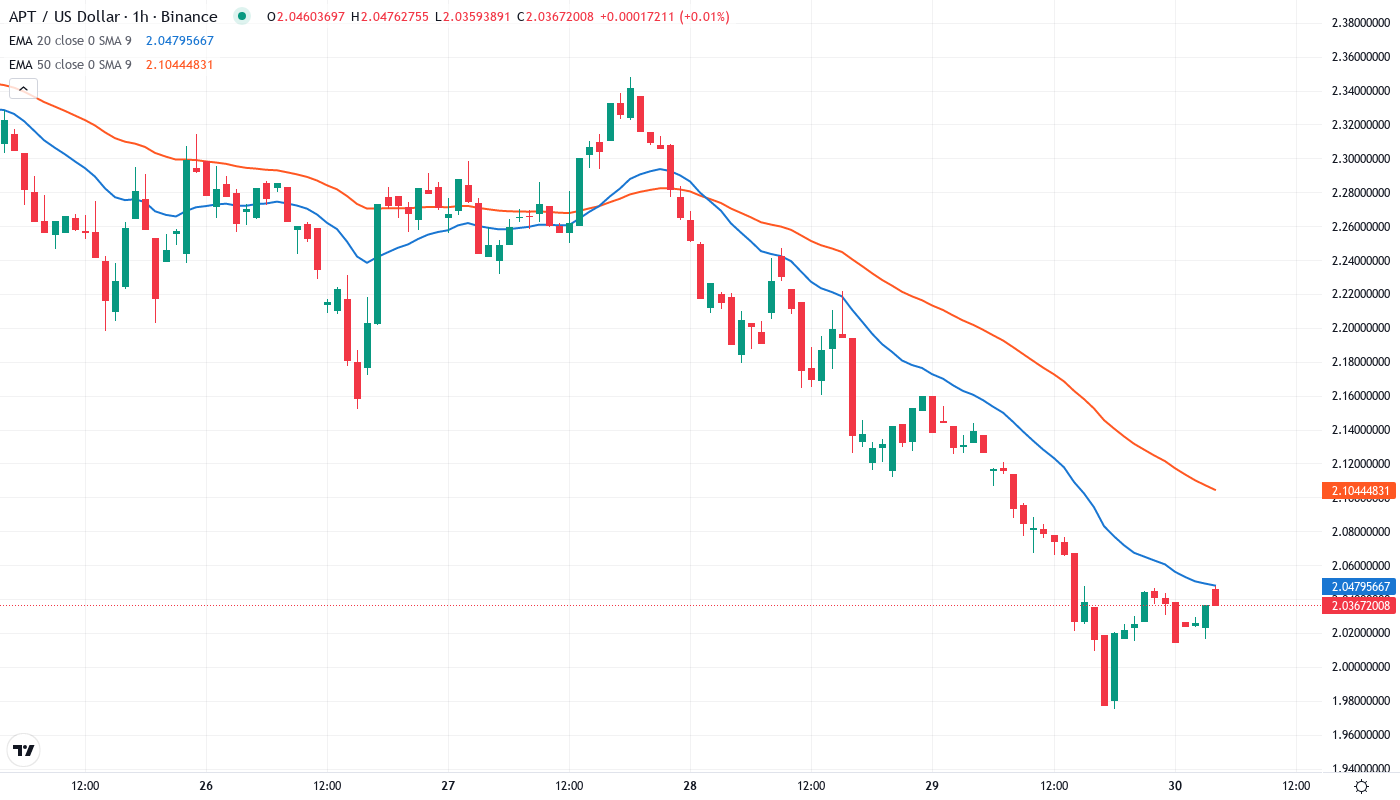
Moving Averages Form Resistance Cloud From $2.28 to $4.30
The sheer velocity of APT’s decline will keep it firmly in oversold territory for some time. As was evident during the recent attempted rally off $2.00, buyers are thin on the ground – and seemingly only waiting to sell at higher prices. This biotechnology stock is likely to need a lengthy base-building period before it is ready to stage another substantive rally.
On December 26, 2021, the last day that seemed stable and bullish for APT, the token’s price sat at $5.55. Yet flash back just a few months to September 25th, 2021 and Apes had confiscated $12.76 per coin in a desperate uptrend. Unlock event fear aside, Ape hasn’t ever gathered enough momentum to consistently recapture its 200-day EMA since the summer of 2021 – another death cross of EMAs back in early October led the way to the plunge below the 2.8-year EMA low.
Support at $1.38 Becomes Final Defense Before Psychological $1.00
There is a lot of resistance that needs to be overcome before a substantial recovery can take place. The first obstacle is the current price of $2.25, which is both December’s breakdown point and the monthly pivot. Additionally, $3.18 (monthly R1) and $3.51 (weekly pivot) have acted as resistance levels and the price has failed to surpass them three times since the unlock news was announced. Therefore, should a relief rally occur, these resistance levels will be a major challenge.
Bulls are relying on an increasingly tenuous floor to buy from before the catalyst fills their lungs with bricks and sends them skipping merrily across the harbor. Make no mistake, if the $1.38 level gives way, XRP is going to $1.00 minimum, and likely much lower.
The way the market is structured right now, it’s obvious it’s not looking good. APT disappeared through its entire 2024 trading window over a month. We destroyed all supports in those four weeks. Weekly witnessed six continuous red candles. A weekly sell-off this persistent normally isn’t seen barring major delists or protocol defaults rushing to the exit. Waron constantly struggled for traction, and when it started gathering some momentum, Boom, unlock started, and Dip thwarted it.
Bulls Need Daily Close Above $2.50 to Halt Freefall
Buyers need to push reserves above this level to break the devastating cycle. Potential upside levels are likely to converge between the 20-day EMA and 50-day SMA around $3.00 and $3.30. It will probably coincide with reduced selling pressure from margin liquidations. If there is a convincing break above the 20-day EMA, sellers will need to drop the price back below the 38.2 percent retracement at $2.10.
If the stock breaks the $1.38 support level and there is significant trading volume, the price could quickly drop to around $1.00. This would cause investors to sell their positions and could drive the price even further down to $0.88. Additionally, the unlocking of shares in December will create more selling pressure, so any price increase will most likely be used by existing shareholders to sell their shares.
Based on the momentum that APT has, and the $1.8 billion unlock that is at his back, the most likely low-probability targeting that will occur here is a grind somewhere between $1.38 and $2.25 until we work off these oversold conditions. To get any sort of real sustained recovery, you would need news that the unlock was being renegotiated, or that there was some adoption news so large that it would mask the supply shock and right now neither one appears likely near term.