VeChain Tests Monthly Support at $0.0117 as Momentum Indicators Flash Reset

Market Pulse
- VET plunged 27.9% from December’s $0.0187 peak, erasing three months of gains in a devastating selloff
- RSI dropped to 38.28 on the daily timeframe, marking first oversold territory since the August washout
- Bulls now guarding the $0.0117 monthly low after six consecutive red weekly candles
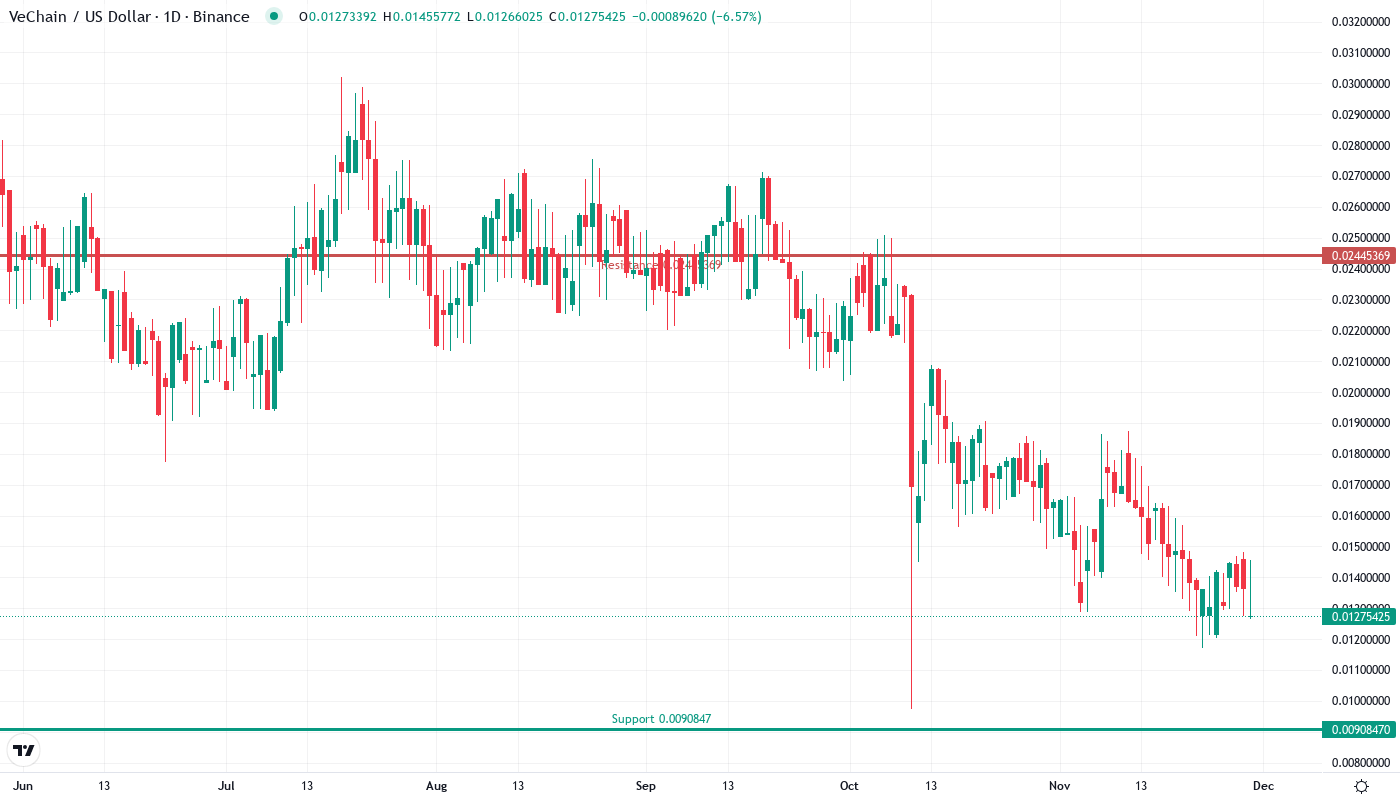
VeChain’s price action tells a brutal story this week, with VET tumbling from $0.0145 to $0.0127 – an 11.36% drop that extended December’s already painful correction. The token has now shed 46.74% over three months and sits 68.99% below its yearly high, making it one of the hardest-hit large-cap altcoins in the current market downturn. The main question for traders is: can the $0.0117 monthly low hold as final support, or are we headed for a deeper flush toward 2023’s bear market lows?
| Metric | Value |
|---|---|
| Asset | VECHAIN (VET) |
| Current Price | $0.01 |
| Weekly Performance | -0.11% |
| Monthly Performance | -27.91% |
| RSI (Relative Strength Index) | 38.3 |
| ADX (Average Directional Index) | 34.5 |
| MACD (MACD Level) | 0.00 |
| CCI (Commodity Channel Index, 20-period) | -76.27 |
RSI at 38.28 Signals First Oversold Reading Since August’s Capitulation
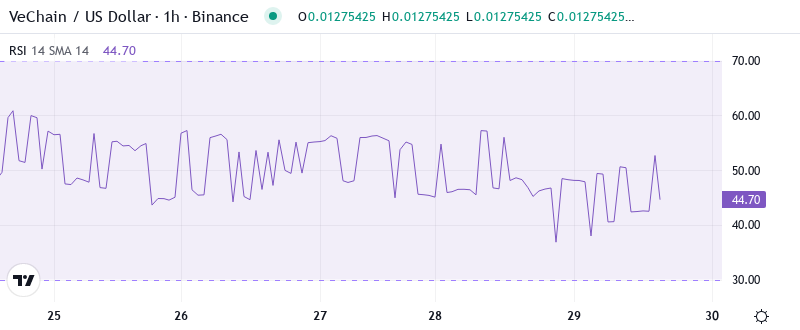
Reading the oscillator at 38.28, traders see VET entering oversold territory for the first time since August’s market-wide crypto washout. This level traditionally marks zones where selling pressure exhausts itself, though it’s worth mentioning that oversold can stay oversold in strong downtrends. The weekly RSI paints an even grimmer picture at 33.81, while the monthly sits at a deeply compressed 22.02 – levels that historically preceded significant bounces in VET’s price action.
What’s revealing is how RSI behaved during the decline – it made lower lows alongside price, confirming genuine selling pressure rather than a healthy correction. Similar RSI configurations in September 2023 preceded a 40% relief rally within two weeks, though that bounce came with stronger market tailwinds. So for swing traders, this oversold bounce potential exists, but the broader trend structure remains decisively bearish until RSI can reclaim and hold above 50.
ADX Climbs to 34.52 as Downtrend Gains Dangerous Momentum
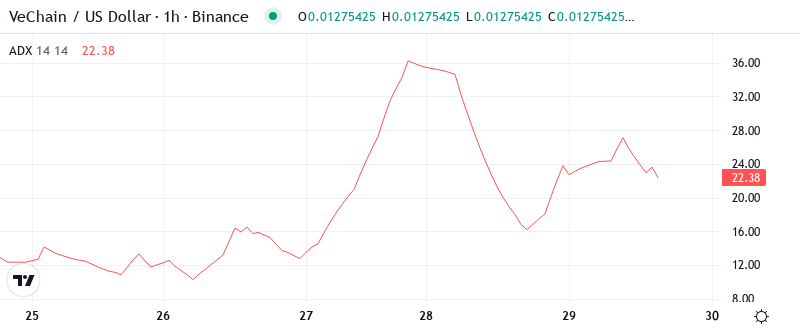
At the level of 34.52, the ADX entry indicates that the downtrend is gaining serious momentum – we’re well past the 25 threshold where trends become tradeable. Basically, being in this zone means directional traders have a clear edge, though unfortunately for bulls, that direction is emphatically down. The ADX surge from 18 to 34 over the past three weeks marks one of the sharpest trend accelerations in VET’s recent history.
To clarify, the ADX is indicating that we’ve switched from December’s choppy consolidation to a trending state – and not the good kind. The combination of ADX above 30 with price below all major moving averages creates what veteran traders call a “trending bear market” configuration. Therefore, day traders should suit their strategies to this change by favoring short setups on rallies rather than trying to catch falling knives at support levels.
Price Trapped Below Entire EMA Ribbon as $0.0163 Becomes Resistance Wall
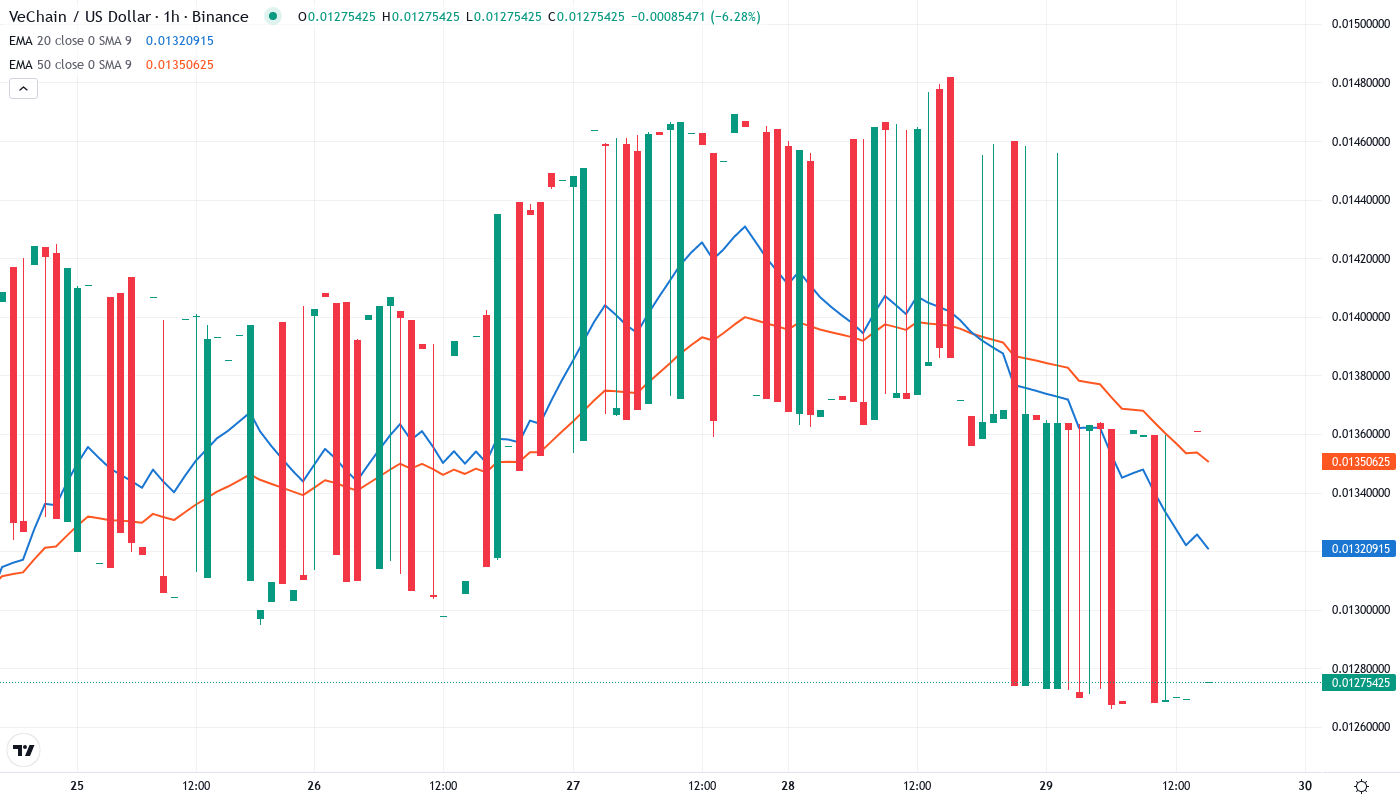
Price action is crystal clear through the EMA ribbons – VET is positioned below the 10-day ($0.0137), 20-day ($0.0144), and more importantly, the 50-day EMA at $0.0150. The 100-day EMA looms even higher at $0.0163, creating a stacked resistance zone that would require significant buying volume to overcome. Most concerning is how the 20-day EMA rejected VET’s relief attempt at $0.0145 earlier this week, confirming that former support levels have flipped to resistance.
Looking at the moving average structure, the death cross between shorter and longer-term EMAs already occurred in early December, signaling the intermediate trend reversal that’s now playing out. The 200-day EMA sits far above at $0.0216, roughly 70% higher than current prices – a gap that illustrates just how severely VET has broken down from its longer-term trend structure. That former support area at $0.0150 (the 50-day EMA) now transforms into a red line that bears will likely defend on any bounce attempts.
Support at $0.0117 Faces Ultimate Test After Six Failed Rally Attempts
The immediate resistance is stacked between $0.0137 (10-day EMA) and $0.0150 (50-day EMA), with December’s breakdown level at $0.0145 acting as the first major hurdle for any recovery attempt. Above that, the psychological $0.015 level coincides with the 50-day EMA, creating a double barrier that rejected price action three times in the past month. The monthly pivot at $0.0172 sits even higher, marking where any sustainable recovery would need to target.
Bulls defend their final support line at $0.0117 – the monthly low that’s been tested twice in December without breaking. This level gains extra significance as it marks the 2023 bear market recovery low, making it a true “line in the sand” for longer-term holders. Below that, there’s an air pocket down to $0.009, where August’s flash crash found buyers, though that 23% drop would likely flush out most leveraged positions.
The market structure signals exhaustion on both sides, with volume declining 18% below the 10-day average as traders await a decisive move. VeChain’s staking surge and new tokenomics deployment provide fundamental support, but the technical picture suggests these positives aren’t enough to overcome the broader market headwinds. Bithumb’s temporary suspension of VET transactions for upgrades added to near-term selling pressure, though this should resolve once trading resumes.
Bulls Need Volume Surge Above $0.0145 to Avoid Deeper Flush
Bulls must secure a daily close above $0.0145 with expanding volume to signal even a basic relief bounce is underway. Should VET reclaim this level, the next targets would be $0.015 (50-day EMA) and then $0.0163 (100-day EMA), though each level represents increasingly difficult resistance. The upcoming UAE DeFi regulations and continued staking adoption could provide the fundamental catalyst needed for such a move.
The bearish scenario triggers if VET loses $0.0117 on a daily close – this would open the trapdoor to $0.009 and potentially lower. Technical patterns suggesting upward momentum remain invalidated as long as price stays below the EMA ribbon, and any bounces into resistance zones would likely attract fresh selling from trapped buyers looking to exit at breakeven.
Given the oversold RSI, deeply negative sentiment, and key support test at $0.0117, the most probable near-term outcome is a relief bounce toward $0.0135-$0.0145 before sellers reassert control. Long-term investors might view these levels as accumulation zones given VeChain’s fundamental developments, but traders should respect the dominant downtrend until price action proves otherwise with a confirmed reversal above the 20-day EMA.