OKB Surges 113% Year-to-Date as Exchange Tokens Dominate Q3 Recovery
Exchange Token Momentum Building
- OKB reclaims key technical levels after devastating 40% monthly correction
- Exchange tokens lead crypto recovery with OKB posting triple-digit yearly gains
- Bulls defend crucial support at $98.54 while eyeing resistance at $113.70
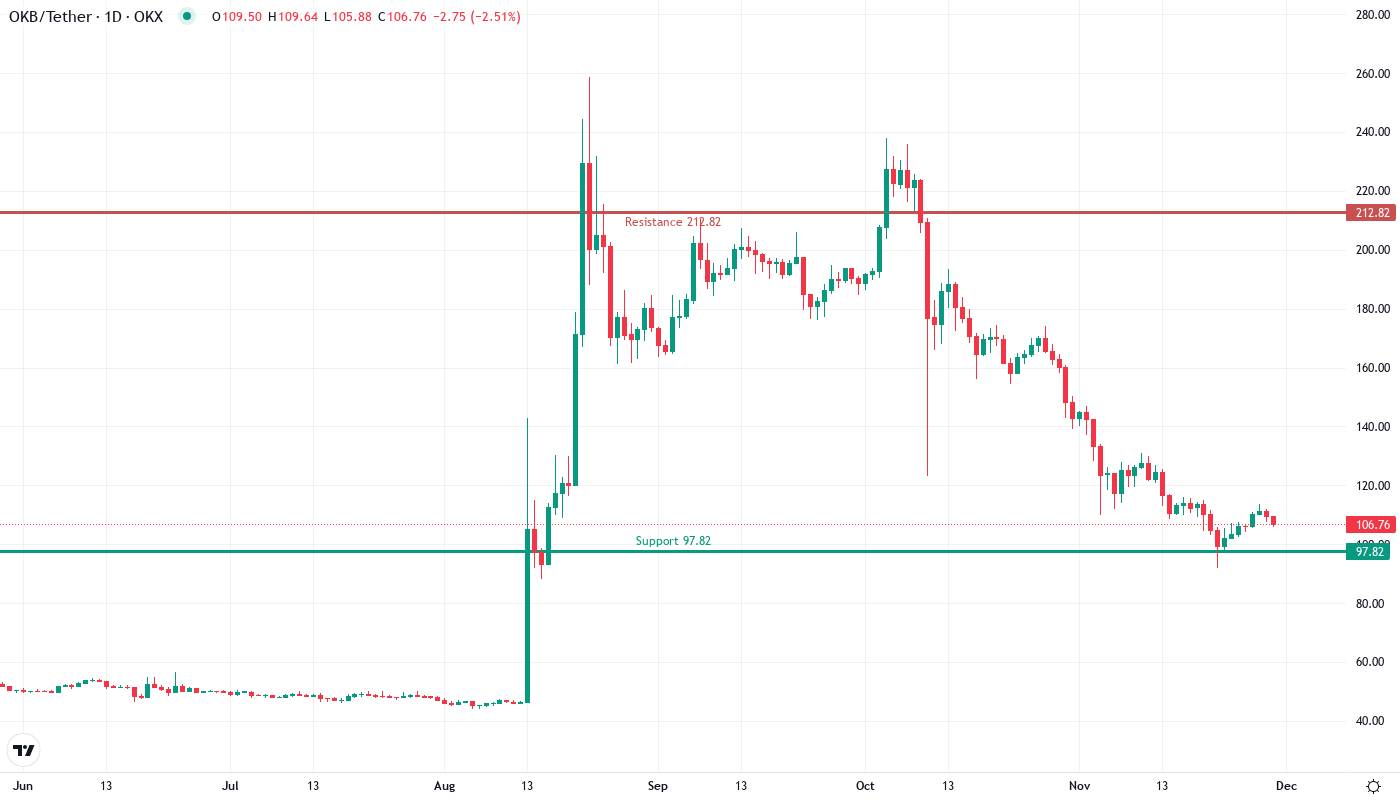
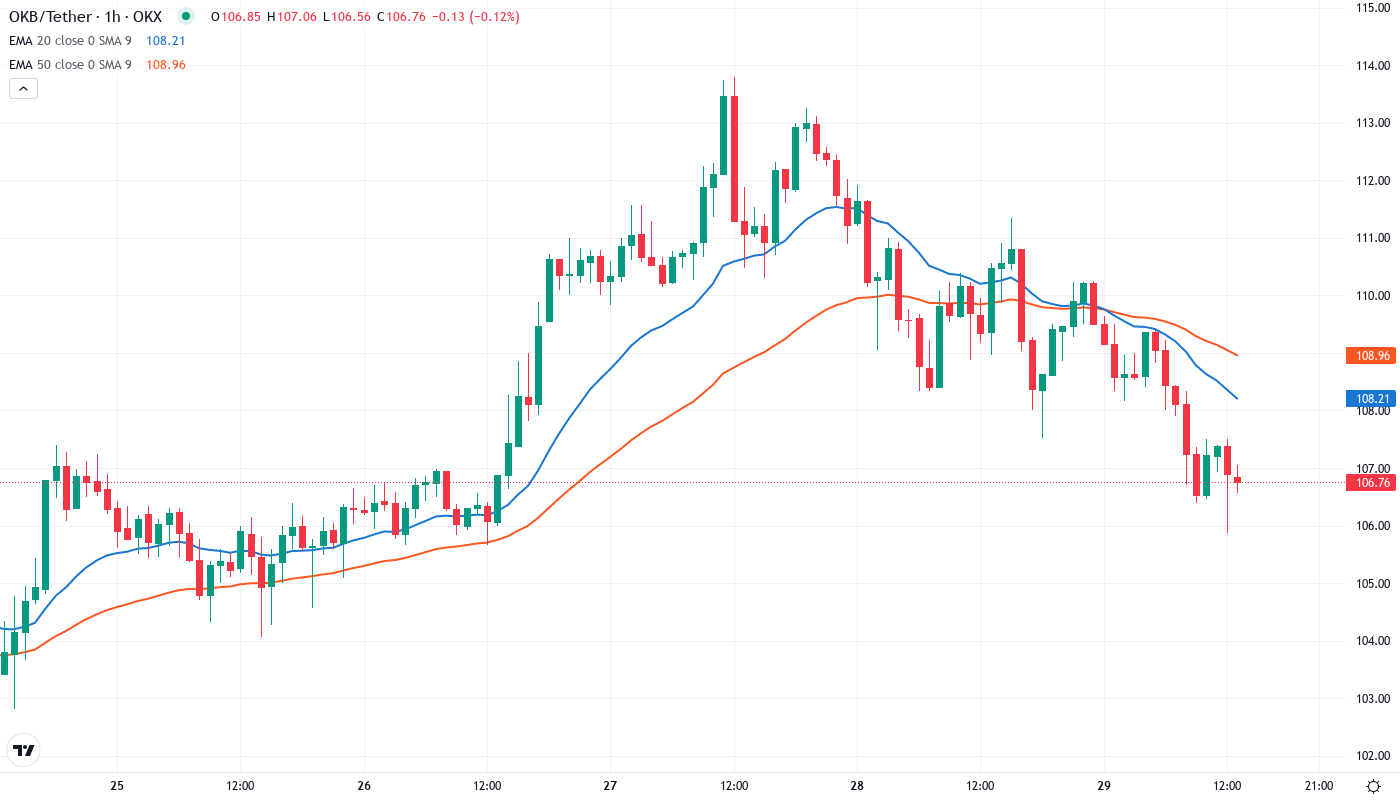
OKB has kick-started a recovery attempt following its devastating monthly drop of 33.33%, though the exchange token maintains impressive yearly gains of 113.21% that outpace broader market performance. The token currently trades at $106.82, having stabilized after tumbling from monthly highs of $150.50 to lows of $91.77 – a brutal correction that wiped out over $58 per token in value. The main question for traders is: Can OKB sustain this bounce as OKX prepares to launch OKB/USDT perpetual contracts, or will sellers reassert control at overhead resistance?
| Metric | Value |
|---|---|
| Asset | OKB (OKB) |
| Current Price | $106.82 |
| Weekly Performance | 7.63% |
| Monthly Performance | -33.33% |
| RSI (Relative Strength Index) | 36.0 |
| ADX (Average Directional Index) | 53.6 |
| MACD (MACD Level) | -8.68 |
| CCI (Commodity Channel Index, 20-period) | -47.38 |
Momentum Exhaustion Signals Potential Floor After December Washout
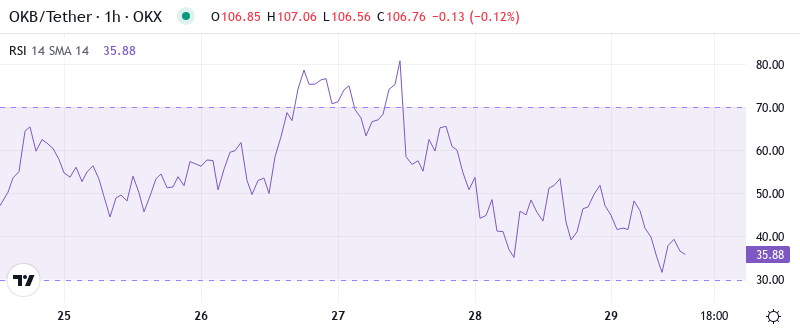
RSI sits at 53.85 on the daily timeframe, marking a sharp recovery from oversold conditions that matched the severity of the price collapse. What’s revealing is how RSI barely budged despite the monthly carnage – currently reading just above neutral territory suggests sellers may have exhausted their ammunition during the recent flush. Similar RSI configurations following exchange token corrections in Q2 preceded multi-week consolidation phases before the next directional move.
So for swing traders, this balanced momentum creates a two-way setup where neither bulls nor bears hold a decisive edge. The weekly RSI at 45.53 confirms the intermediate-term damage while the monthly reading of 43.95 shows OKB hasn’t reached capitulation levels seen during bear market bottoms. Basically, momentum indicators suggest we’re in no-man’s land where the next significant move depends on whether buyers can defend recent lows or sellers reload for another leg down.
ADX at 53.56 Confirms Mature Downtrend Seeking Exhaustion
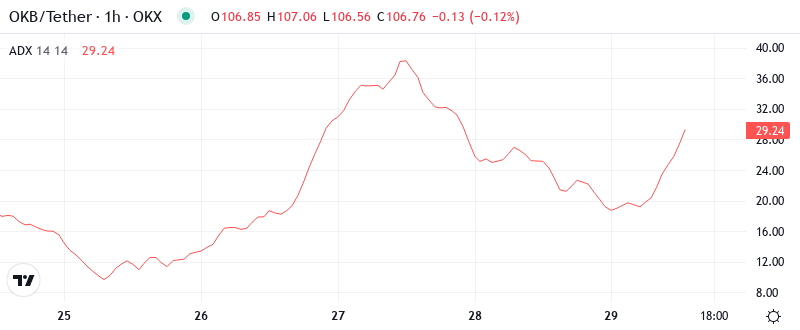
Looking at trend strength, the ADX reading of 53.56 signals an extremely mature trending move that’s approaching historical reversal zones. This elevated ADX level indicates the monthly selloff carried serious conviction – not just a garden-variety pullback but a genuine trend that cleared out leveraged longs. To clarify, when ADX climbs above 50, it often marks the final acceleration phase before trend exhaustion sets in.
Therefore, day traders should prepare for a potential shift from trending to ranging conditions as this extreme ADX reading typically precedes consolidation periods. The combination of recovering price action with sky-high ADX creates a classic setup where the dominant trend loses steam while the market digests the recent move. It is worth mentioning that OKX’s upcoming perpetual contract launch could provide the catalyst to either resume the downtrend or confirm a bottom formation.
50-Day EMA at $120.79 Looms as Major Resistance Hurdle
Price action reveals OKB trading well below its entire moving average structure, with the nearest resistance at the 10-day EMA ($108.59) just $1.77 overhead. The 20-day ($113.70) and 30-day ($131.06) EMAs create a stacked resistance zone that bulls must conquer to shift the technical picture. Most significant is the 50-day EMA at $120.79, which has transformed from support during the rally phase to formidable resistance following December’s breakdown.
Currently, the compression between price at $106.82 and the 10-day EMA suggests an imminent directional decision. Bulls need to reclaim the 20-day EMA at $113.70 to signal genuine recovery potential – this level served as support multiple times during the uptrend before failing dramatically in December. The 100-day EMA sits distant at $119.31, while the 200-day at $101.05 provides a safety net roughly $5.77 below current levels, marking the last line of defense for the longer-term uptrend.
Resistance Wall Between $112.90 and $119.75 Gates Recovery
Above current price, sellers have stacked multiple resistance layers with the immediate hurdle at $112.90 followed by the psychological $115 level. The zone between the monthly pivot at $113.70 and the 50-day EMA at $120.79 represents the critical battlefield where bulls must prove their mettle. December’s highs near $150.50 remain distant targets requiring a 41% surge from current levels.
Bulls defend multiple support layers with immediate backing at $98.54 followed by stronger foundations at the 200-day EMA ($101.05). The psychological $100 level adds extra significance to this support cluster, especially as exchange tokens across the sector show relative strength during the broader crypto recovery. Monthly lows at $91.77 mark the absolute floor that bulls cannot afford to lose without triggering deeper technical damage.
This configuration resembles a classic bottoming pattern where price finds equilibrium between strong support and overhead supply. The upcoming OKB/USDT perpetual contract launch on OKX could inject fresh trading volume and liquidity, potentially providing the momentum needed to attack resistance or confirming support levels through increased spot demand. Exchange tokens historically benefit from new trading product launches as they create additional utility and trading opportunities.
Bulls Require Decisive Close Above $113.70 to Confirm Recovery
Should OKB reclaim the 20-day EMA at $113.70 with conviction, the path opens toward the 50-day EMA at $120.79 where more substantial resistance awaits. The perpetual contract launch could act as the fundamental catalyst to drive this breakout, particularly if it attracts new institutional flows seeking exposure to exchange token momentum.
The setup fails if price surrenders the $98.54 support level on heavy volume, which would likely trigger stops down to the 200-day EMA at $101.05. A breakdown below $91.77 would trap recent dip buyers and potentially cascade toward $80, erasing much of the yearly gains that currently stand at an impressive 113%.
Given the technical configuration and upcoming product launches, the most probable near-term scenario sees OKB consolidating between $98.54 and $113.70 while digesting December’s violent correction. Exchange tokens’ outperformance during Q3’s crypto recovery suggests OKB could surprise to the upside once this consolidation phase completes, especially with new perpetual contracts adding fresh market dynamics.