Polkadot Tests $2.27 Support as ADX Climbs Past 35 – Bulls Guard Critical Floor

Market Structure Shifts Lower
- DOT trades at $2.27, down 26.3% this month after failing to hold above $3
- ADX surge to 35.86 signals genuine trend strength building – unfortunately for bulls, it’s bearish
- Six-month decline of 44.2% brings price to test Wyckoff spring levels from recent accumulation
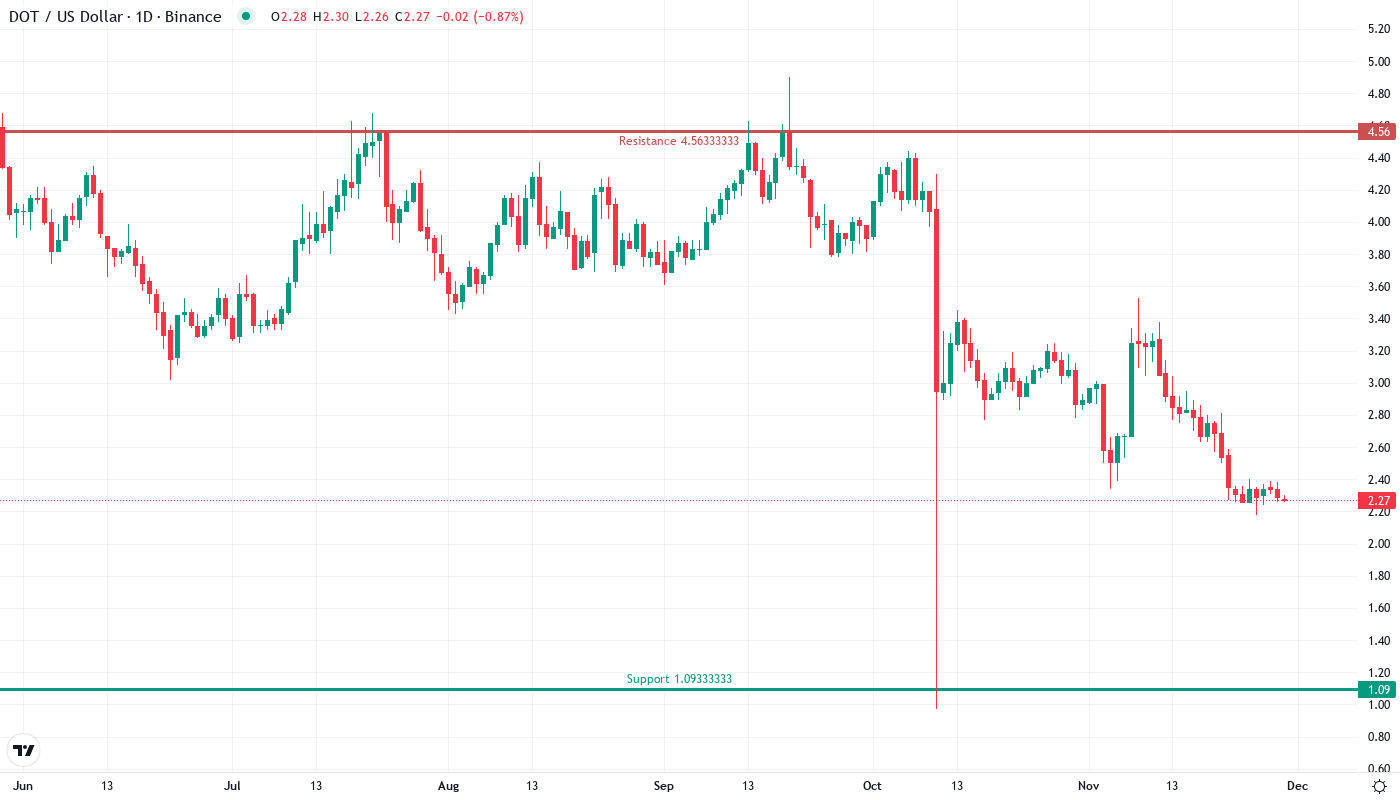
Polkadot has endured a devastating drop over the past month, shedding 26.3% to land precisely at $2.27 – a level that now represents both the weekly and monthly close. The coin’s three-month performance paints an even grimmer picture at -40.4%, though interestingly, technical patterns suggest this bloodbath might be setting up something more constructive. The main question for traders is: can bulls defend this Wyckoff spring level that formed during recent accumulation, or will the bearish momentum that’s been building since October finally break through?
| Metric | Value |
|---|---|
| Asset | POLKADOT (DOT) |
| Current Price | $2.27 |
| Weekly Performance | -2.99% |
| Monthly Performance | -26.30% |
| RSI (Relative Strength Index) | 32.8 |
| ADX (Average Directional Index) | 35.9 |
| MACD (MACD Level) | -0.20 |
| CCI (Commodity Channel Index, 20-period) | -84.15 |
Momentum Exhaustion Shows Up at 32.77 – Matches Wyckoff Spring Territory
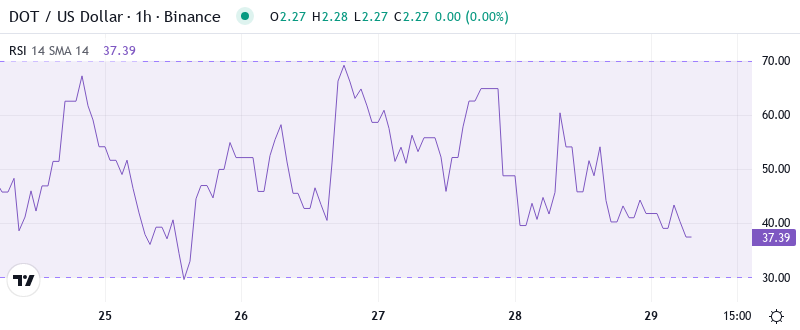
RSI sits at 32.77 on the daily timeframe, hovering just above oversold territory in what traders recognize as the capitulation zone. What’s revealing is how this reading aligns perfectly with the Wyckoff spring pattern that market structure analysts have been tracking – the same configuration that preceded sharp reversals in August and September when RSI touched similar levels.
For swing traders hunting reversal setups, this RSI configuration combined with the textbook Wyckoff accumulation completion creates an interesting risk-reward scenario. The oscillator hasn’t quite capitulated into the sub-30 zone where panic selling typically exhausts itself, suggesting there might be one more flush lower before genuine accumulation begins. Enterprise demand shifting toward blockchain interoperability adds fundamental support to any technical bounce from these levels.
ADX at 35.86 Confirms Mature Downtrend – But Exhaustion Looms
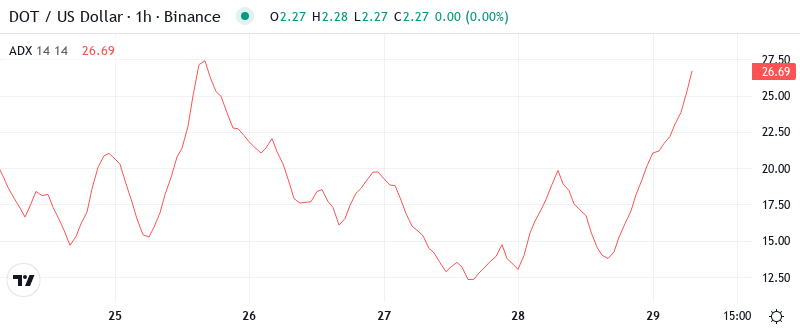
Looking at trend strength indicators, the ADX reading of 35.86 tells a clear story – this isn’t choppy consolidation anymore, but a legitimate trending move with conviction behind it. At these levels, the ADX indicates that sellers have controlled price action decisively, transforming what started as profit-taking above $3 into a full-blown correction that’s now testing critical support zones.
Historically, when DOT’s ADX climbs above 35 during downtrends, it often signals we’re in the final innings of the move. The trend has matured enough that momentum traders who’ve been riding it lower start booking profits, while value hunters begin accumulating positions. So for day traders, this elevated ADX reading suggests sticking with the trend until it shows clear signs of exhaustion, but keeping stops tight as reversal risk increases at these extremes.
20-Day EMA at $2.66 Caps Recovery Attempts After December Breakdown
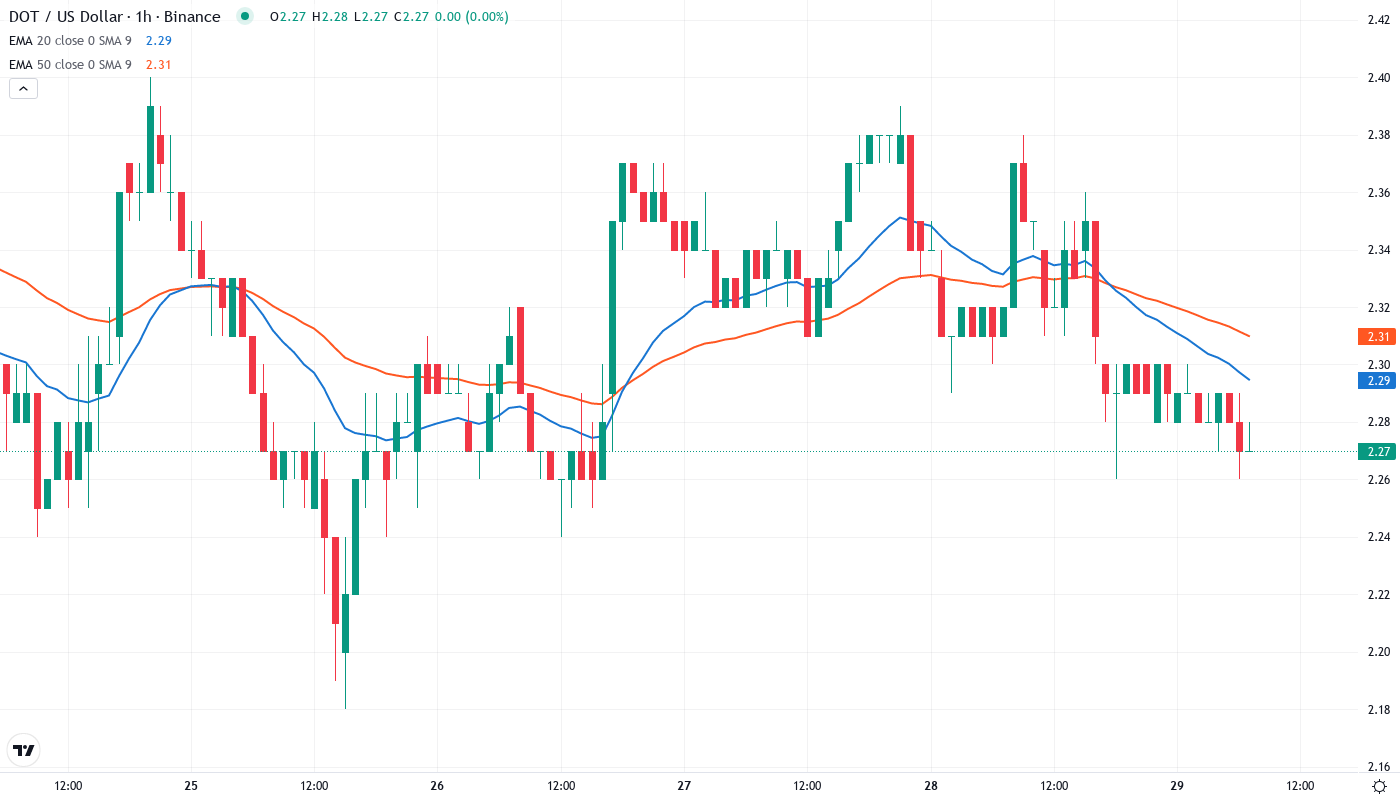
The moving average structure tells a bearish tale, with DOT trading below every major EMA in the toolkit. Price sits beneath the 10-day ($2.38), 20-day ($2.53), and crucially, the 50-day EMA at $2.66 – each acting as resistance on any relief bounce attempts. Most telling is how the 20-day EMA, which provided support throughout November’s accumulation phase, flipped to resistance after the December breakdown and has rejected two recovery attempts since.
Bulls face a stacked deck of resistance overhead, with the 50-day EMA at $2.66 representing the first major hurdle for any sustainable recovery. The 100-day EMA lurks higher at $2.88, while the 200-day EMA at $3.24 seems like a distant dream at this point. This compressed cluster of moving averages between $2.38 and $2.88 creates what traders call an “EMA cloud” – a zone where trapped longs from the past month will likely supply selling pressure on any bounce.
Support Architecture Builds From $2.27 Down to Monthly S1 at $1.09
The immediate support sits right at current levels, with $2.27 representing not just today’s price but also the weekly and monthly closes – a triple confluence that bulls must defend. Below that, the monthly pivot point at $2.77 has already been surrendered, transforming from support to resistance in classic fashion. The next meaningful support doesn’t arrive until the monthly S1 level at $1.09, though psychological levels at $2.00 and $1.50 should provide some buying interest.
Resistance stacks up formidably overhead, starting with the 10-day EMA at $2.38 as the first test for any bounce. Beyond that, sellers have fortified positions at the 20-day EMA ($2.53), the 50-day EMA ($2.66), and the surrendered monthly pivot at $2.77. The December highs near $3.53 now feel impossibly distant, representing a 55% rally from current levels.
Market structure reveals a clear bearish bias as long as price remains below $2.66 – the 50-day EMA that’s acted as the dividing line between accumulation and distribution phases. The completed Wyckoff accumulation pattern that analysts celebrated last week now faces its first real test, with the spring level at $2.69 already breached. This breakdown below the spring transforms what looked like a bullish setup into a potential bull trap, though the extreme oversold conditions suggest at least a relief bounce is overdue.
Bulls Need Reclaim of $2.66 to Salvage Wyckoff Pattern
For the bullish scenario to materialize, DOT needs to reclaim the 50-day EMA at $2.66 on a daily close, which would negate the breakdown below the Wyckoff spring and trap late shorts. Such a move would target the monthly pivot at $2.77 as the next objective, with enterprise adoption of Polkadot’s interoperability features providing the fundamental catalyst for sustained buying pressure.
The bearish path activates if DOT loses $2.27 support on volume, confirming the failed Wyckoff pattern and likely triggering stop-losses down to the psychological $2.00 level. This scenario would complete a measured move from the $3.53 December high, potentially flushing out remaining weak hands before finding a true bottom near the monthly S1 at $1.09.
Given the mature downtrend signaled by ADX and the oversold RSI approaching historical bounce zones, the most probable near-term path is a relief rally back to the 20-day EMA at $2.53, followed by another test of $2.27 support as the market digests whether the Wyckoff accumulation pattern remains valid or has definitively failed.