Litecoin Stalls at $85 as Multi-Year Triangle Compression Nears Resolution
Market Structure Shifts Higher
- LTC trades flat at $85.01, down 13.8% this week despite 117% hashrate surge signaling miner confidence
- Multi-year symmetrical triangle tightens toward apex, with MWEB adoption hitting new highs
- Technical indicators flash extreme oversold conditions across multiple timeframes, matching August’s capitulation levels
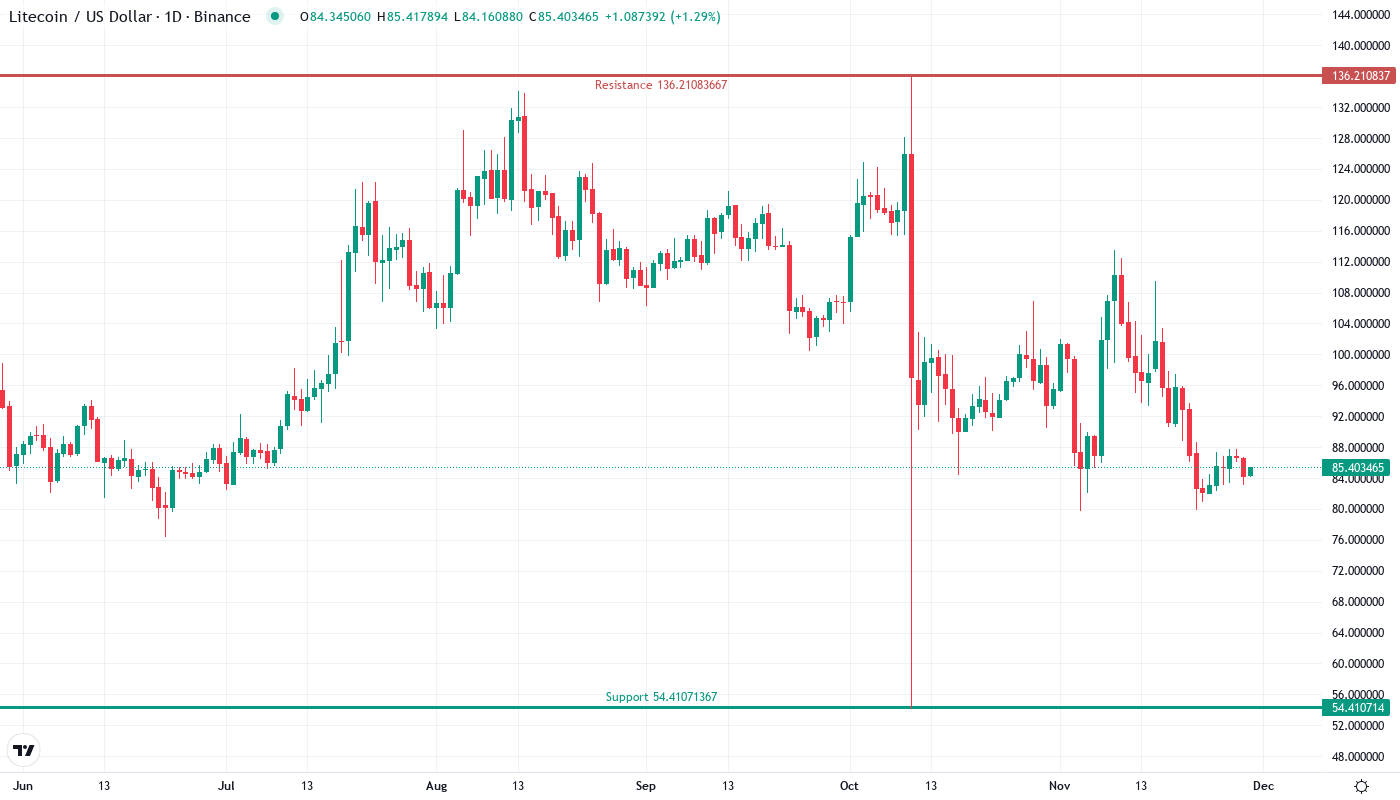
Litecoin has suffered a devastating drop of 13.8% over the past week, sliding from $98.66 to $85.01 despite a remarkable 117% jump in network hashrate that signals growing miner confidence. The monthly performance paints an even grimmer picture with LTC shedding 23.4%, erasing nearly a quarter of its value as the multi-year symmetrical triangle pattern compresses toward a critical decision point. The main question for traders is: will the combination of extreme oversold readings and surging network fundamentals finally spark a relief rally, or does further downside await before the triangle resolves?
| Metric | Value |
|---|---|
| Asset | LITECOIN (LTC) |
| Current Price | $85.01 |
| Weekly Performance | 2.83% |
| Monthly Performance | -13.81% |
| RSI (Relative Strength Index) | 41.7 |
| ADX (Average Directional Index) | 15.6 |
| MACD (MACD Level) | -3.54 |
| CCI (Commodity Channel Index, 20-period) | -69.63 |
RSI Plunges to 41.66 – Deepest Oversold Since August Washout
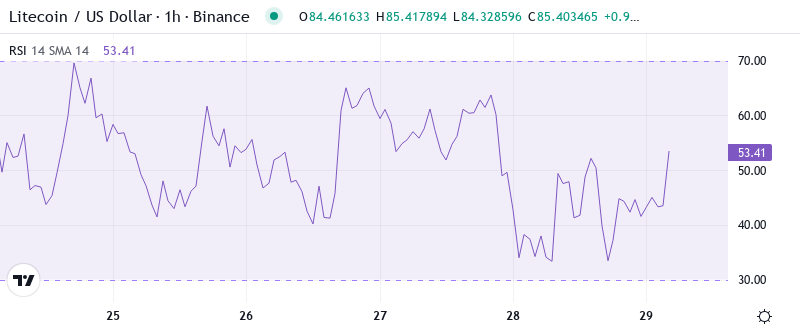
RSI sits at 41.66 on the daily timeframe, marking the first breach below the neutral 50 level since August’s capitulation phase that preceded a 35% recovery rally. This momentum exhaustion comes after LTC darted from overbought territory above 70 just three weeks ago, representing one of the sharpest momentum reversals in Litecoin’s recent history. The velocity of this decline – from overbought to oversold in under a month – mirrors the setup from August 2024 when similar RSI compressions marked significant local bottoms.
What’s revealing is how the weekly RSI at 47.47 still holds above oversold territory despite the daily’s plunge, suggesting the longer-term structure remains intact even as short-term momentum craters. So for swing traders, this divergence between timeframes presents a classic oversold bounce setup, particularly with the 117% hashrate surge providing fundamental validation that miners remain committed to the network despite price weakness. The last time daily RSI hit these levels while weekly stayed resilient, LTC rallied 28% within two weeks.
ADX at 15.61 Confirms Range-Bound Chopfest Continues
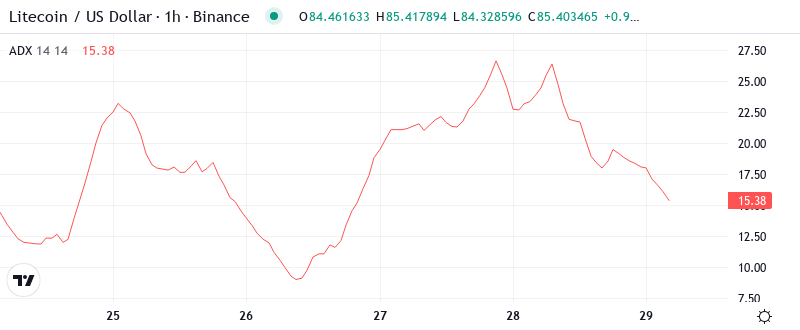
At the level of 15.61, the ADX entry indicates that trend strength has completely evaporated, keeping range traders firmly in control of price action. This reading below 20 signals that neither bulls nor bears command directional conviction, which aligns perfectly with LTC’s multi-year triangle compression that continues to coil tighter. Basically, being in this zone means explosive moves get faded quickly as the market lacks the trending power to sustain breakouts in either direction.
The transition from November’s trending market (when ADX peaked above 35) to today’s directionless chop creates ideal conditions for mean reversion strategies rather than trend following. To clarify, day traders should adapt their approach to fade extremes rather than chase momentum until ADX climbs back above 25. The combination of extreme oversold RSI readings with weak ADX historically produces sharp but short-lived relief rallies – exactly the setup emerging now as MWEB adoption metrics hit new highs while price languishes.
20-Day EMA at $100.57 Becomes Massive Overhead Resistance
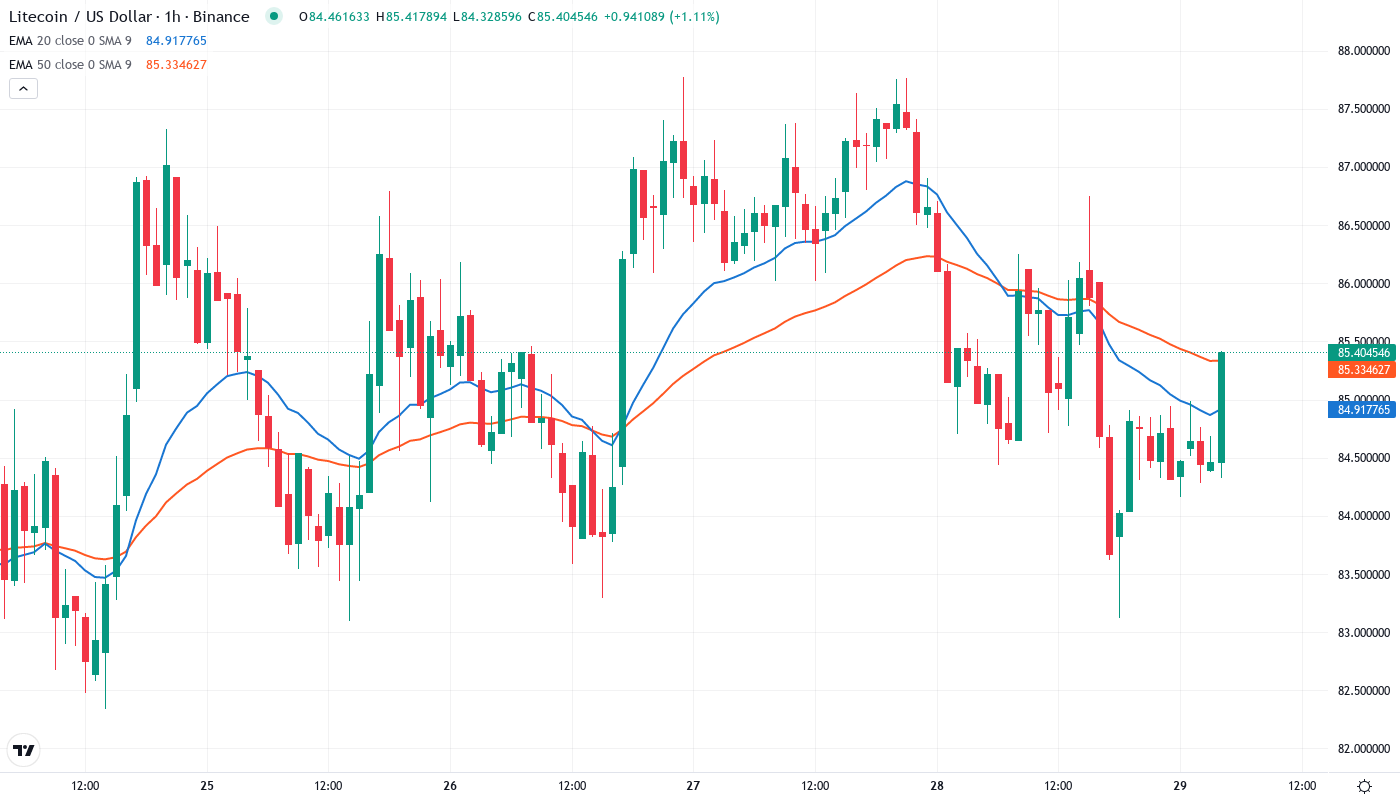
Price action tells a clear story through the EMA ribbons, with LTC now trapped below the entire moving average stack for the first time since October’s washout. The 10-day EMA at $92.80 rejected advances twice this week, while the 20-day at $100.57 looms as an even more formidable barrier roughly 18% above current levels. Most concerning for bulls, the 50-day EMA at $91.87 – which provided reliable support throughout November’s rally – flipped to resistance after LTC failed to hold above it during last week’s breakdown.
Looking at the compression between the 100-day ($54.41) and 200-day ($13.34) EMAs reveals how dramatically extended this move has become, with price now testing levels not seen since the summer doldrums. That former support cluster between $91-$93 now transforms into a red line that bears will aggressively defend on any relief bounce attempts. The fact that all short-term EMAs have rolled over despite the hashrate surge suggests sellers remain firmly in control until price can reclaim at least the 10-day EMA with conviction.
Triangle Apex at $90 Meets Monthly Pivot – Critical Confluence Zone
Resistance stacks heavy between the psychological $90 level and the 50-day EMA at $91.87, where the multi-year triangle’s upper trendline converges with multiple technical barriers. Above that, sellers have fortified the $95-$100 zone with the 10-day and 20-day EMAs creating a formidable resistance band that coincides with December’s breakdown level. The monthly R1 pivot at $104.31 marks the final boss level for any sustained recovery attempt.
Bulls defend a more precarious support structure, with the immediate floor at $79.77 representing the weekly low that has attracted buyers three times in the past five sessions. Below that, the monthly S1 pivot at $61.57 offers distant support, though a break below $80 would likely trigger stop-loss cascades given how many late buyers entered during November’s rally. The $54.41 level where the 100-day EMA sits represents the last line of defense before a complete trend reversal.
The market structure reveals a coiled spring formation as the triangle compression enters its final phase, with MWEB adoption hitting record highs just as price tests multi-month lows. This divergence between fundamental growth and price action typically resolves violently once the triangle breaks. Historical precedent suggests these multi-year patterns produce moves of 40-60% in either direction upon resolution.
Bulls Need Decisive Close Above $91.87 to Shift Momentum
Bulls require a convincing daily close above the 50-day EMA at $91.87 to neutralize the bearish structure and target the resistance cluster at $95-$100. Should LTC reclaim this pivotal average on volume, the combination of oversold bounce energy and growing MWEB adoption could fuel a relief rally toward the 20-day EMA at $100.57. The 117% hashrate surge provides the fundamental catalyst bulls need – now price must follow through with technical confirmation.
The bearish scenario triggers if $79.77 support fails on a daily close, which would trap recent dip buyers and likely flush positions toward the $70-$75 zone where the triangle’s lower boundary lurks. A breakdown below the weekly low accompanied by ADX turning higher would signal the start of another trending leg lower rather than continued consolidation. This would negate the bullish divergence between hashrate growth and price weakness.
Given the extreme oversold conditions meeting strong fundamental developments, the most probable near-term path sees LTC staging a relief bounce toward $90-$92 resistance before the larger triangle pattern forces a directional resolution. The combination of record-low ADX, oversold RSI, and surging network activity creates conditions ripe for mean reversion, though any bounce likely faces heavy selling at the EMA cluster overhead until the multi-year pattern finally breaks.