Toncoin Consolidates Near Critical Support as RSI Signals Oversold Relief Bounce Potential
Market Structure Shifts Lower
- The Token project’s native asset has been under severe selling pressure this week as TON Coin’s considerable market release pressured its price and value.
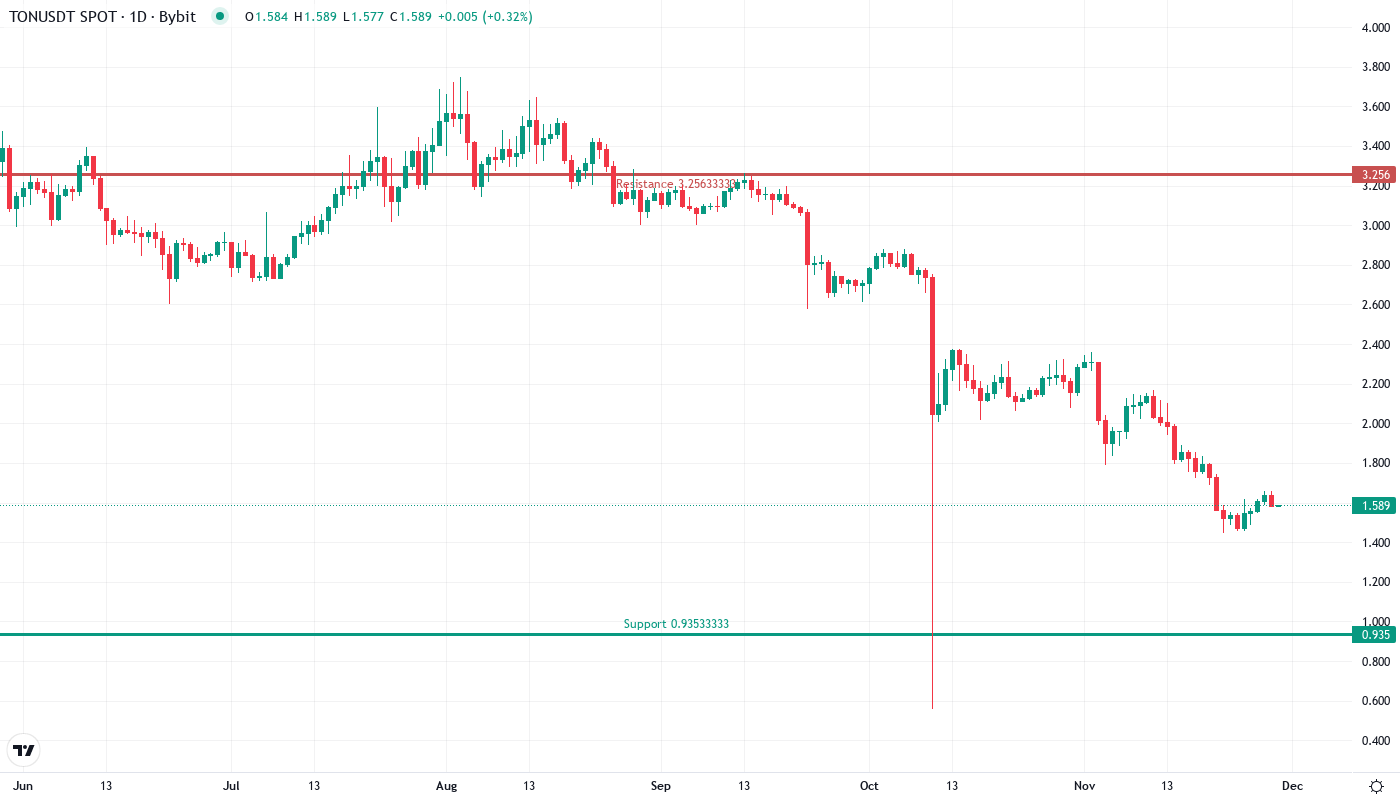
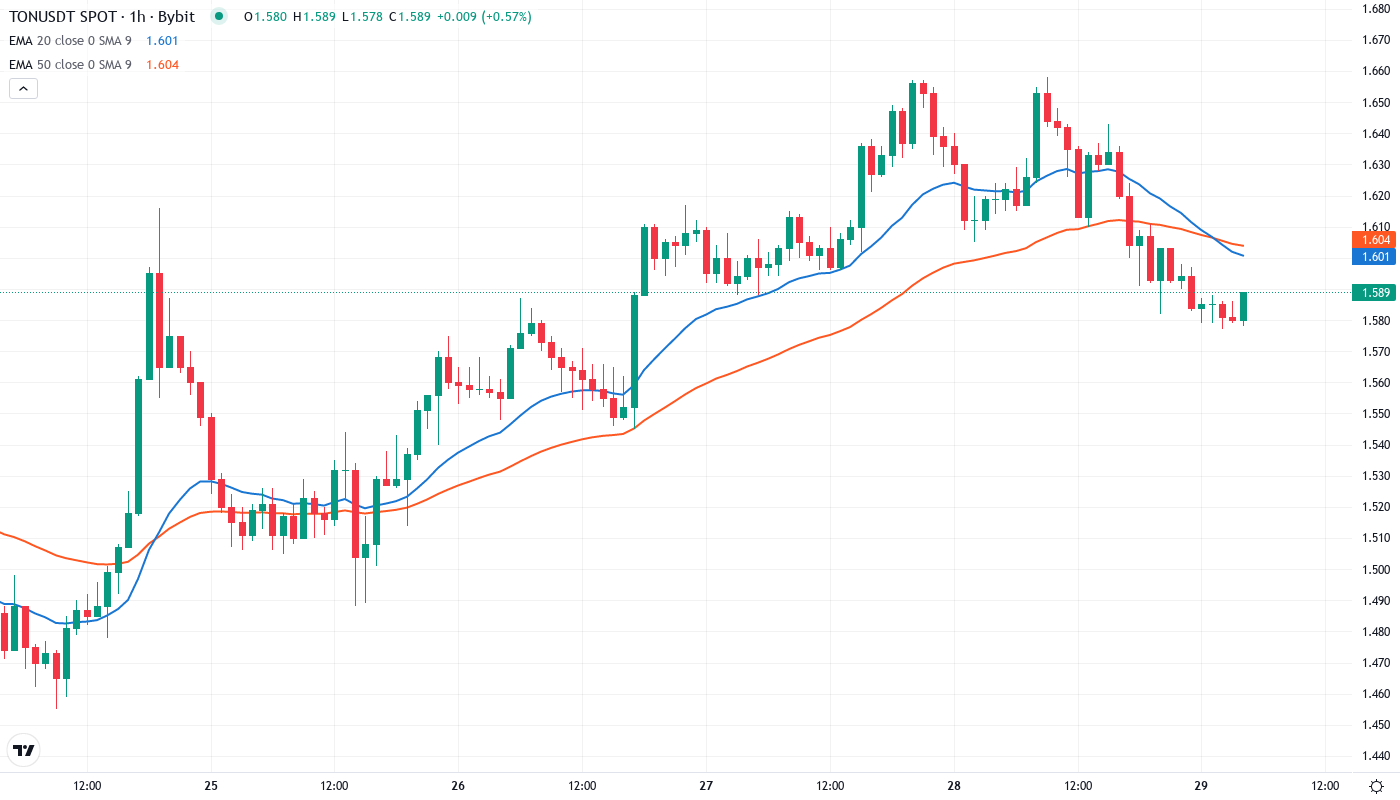
- The price action suggests growing trepidation as the token is struggling to maintain $1.60, with the 200DMA offering some support but the 1-year trendline resistance capping upside moves.
- If the bears can push through $1.45, a quick move to the 7th June low of $1.11 could be seen – this would mark the final last ditch support before TON is free to explore a rapid decline in price discovery as bulls holding the last of the token unlock throw the towel in.
| Metric | Value |
|---|---|
| Asset | TONCOIN (TON) |
| Current Price | $1.59 |
| Weekly Performance | 4.07% |
| Monthly Performance | -28.33% |
| RSI (Relative Strength Index) | 35.2 |
| ADX (Average Directional Index) | 52.2 |
| MACD (MACD Level) | -0.14 |
| CCI (Commodity Channel Index, 20-period) | -59.47 |
RSI Hits 35.2 – Oversold Territory Matches Previous Bounce Zones
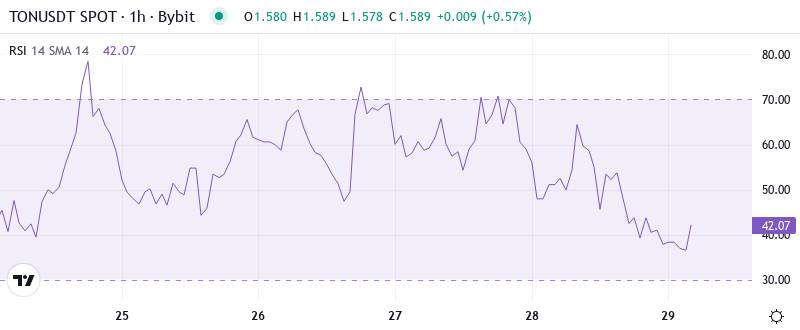
The Relative Strenght Index (RSI) is currently at 35.23 on a daily scale, indicating that we are in an oversold situation. When we have been at this level in the past, some relief bounces have occurred. As shorts tire out, the accumulated buys open a path upwards. Going off the same logic, this week the RSI comes in at 29.0 highlighting the extremely oversold conditions on multiple time increments.
What is interesting to note is the behavior of RSI during the decline. It kept going down without showing any uptick which means it was more of a distribution phase than a panicked selloff. This makes a compelling case for swing traders to attempt a mean reversion with the RSI in oversold territory and the added event of Coinbase listing providing an additional catalyst. Having said that, RSI can remain oversold for an extended period in a strong downtrend.
ADX at 52.15 Confirms Mature Downtrend Nearing Exhaustion Point
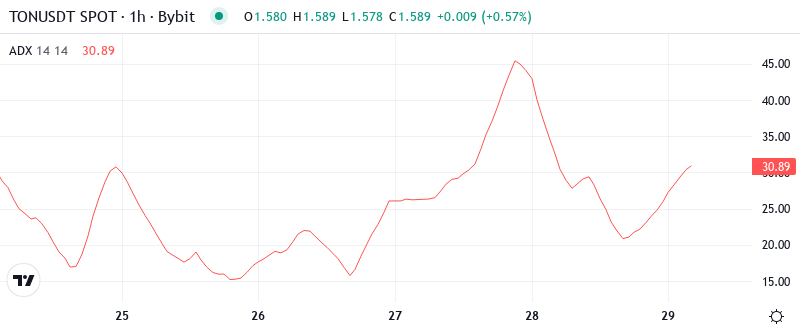
The ADX is currently around 52.15, meaning we are in a very strong trending environment – one of the highest readings we’ve seen for TON this year. This high ADX helps to indicate that the recent selloff was the real deal and not simply some light profit-taking. It was a strong enough move, catalysed by the arrival of the largest token unlock supply on exchange this year, to push all those following trends into the market.
More importantly though, for medium- to longer-term investors wishing to take a position against the downtrend, a craftier strategy than selecting an arbitrary spot to go short would be to wait until the ADX confirms the new medium-term uptrend. This makes sense given only a confirmed trend, up or down, can provide a profitable ride for a steady hand in the months ahead.
Price Trapped Below Entire EMA Ribbon Since Token Unlock Hit
Looking ahead, TON is eyeing a test of the long-term 88% retracement support level, but developing a do-or-die level above that psychological S/R zone at $1.00 is the more important prerequisite. However, diminishing downside targets here are calculated using the time-based FTD support levels (some are below the ultimate 88% long-term level at $.0775) from the 2018-2019 accumulation, with some major support levels listed below. If TON breaks $.0775 on a candlestick close, enters price discovery, and all historic price averaging goes out the window.
The most important development is the 50-day EMA offering support during the August rally shifting to resistance during the December decline. That level turned back recovery efforts twice in the past week to confirm that sellers have the upper hand in the medium-term trend. The $0.02 gap between current price ($.0006) and the nearest resistance (10-day EMA at $.0006) could easily be recaptured if buyers return, but bulls will need enough volume to absorb the overhead supply.
Multiple Support Tests at $1.45 Build Case for Potential Floor
There are resistance clusters between $1.62 and $1.72, as the 10 and 20-day EMAs meet with recent rejection points. Beyond that, the $2.00 psychological level coincides with the 50-day EMA, capping any upside momentum. The monthly pivot point at $1.91 reinforces this resistance cluster. Changes in sentiment are required to the upside for the path higher to become much easier.
Buyers are struggling to reclaim the crucial $2.00 level, offering a potential longer-term swing failure. A break above the psychological $2.00 level would likely contribute to the overall uptrend with the next significant resistance at the $2.20 level. A breach beyond that upper edge would provide a foothold to additional upside throughout the end of Q1 and into Q2 with potential pullbacks to test $2.20 supports.
The pattern unfolding over the past five months has the look of a potential double bottom, which centers on $1.30, a level defended last week. A convincing lift-off from this area could attract bottom-pickers. Protect against a weekly close beneath $1.30. A November high at $1.60 guards resistance at $1.73, followed by the late-September high at $2.03.
Oversold Bounce Targets $1.72 While Bears Eye Break Below $1.45
If the price is able to increase and go beyond $1.72, XLM/USD could make a move towards $1.85. The relative strength index (RSI) is in positive territory with a reading of 54, and the moving average convergence divergence (MACD) trend indicator seems to be reflecting upward price movement with its positive slope.
The setup will be invalid if TON drops below the daily pivot and the $1.30 level, but the risk/reward tends to be good enough for a new long swing position at that level, possibly targeting a break-even or $1.45 stop in case the downside remainder has already exhausted itself.
Considering the oversold nature, repeated support checks, and favorable Coinbase news in the face of recent unlock selling, the most likely immediate direction is a bounce back to $1.65-$1.72 before encountering overhead pressure from the moving averages. Such decline may include a weekly decline violating the late-2020 low. For long-term HODLers, these are likely zones for adding to an existing position but for short-term-oriented traders, the trend remains your friend until demonstrated otherwise.