IOTA Plunges 19% as Africa Trade Platform News Fails to Stem Technical Breakdown
Market Structure Shifts Lower
- IOTA crashes through multiple support levels, down 19.2% weekly despite major African trade platform launch
- Technical indicators flash oversold across all timeframes as price tests critical $0.116 support zone
- Africa’s $70B stablecoin trade initiative using IOTA technology provides fundamental floor, but sellers dominate near-term
IOTA’s devastating drop accelerated this week, with the token shedding 19.2% to trade at $0.116 despite groundbreaking news of Africa launching an IOTA-powered trade platform spanning all 55 nations. The contrast between bullish fundamental developments and bearish price action tells a story of broader market forces overwhelming project-specific catalysts. The main question for traders is: will the African trade initiative’s $70 billion potential provide enough fundamental support to arrest this technical breakdown, or will sellers continue pressing lower toward the psychological $0.10 level?
| Metric | Value |
|---|---|
| Asset | IOTA (IOTA) |
| Current Price | $0.12 |
| Weekly Performance | -1.19% |
| Monthly Performance | -19.22% |
| RSI (Relative Strength Index) | 36.5 |
| ADX (Average Directional Index) | 36.6 |
| MACD (MACD Level) | -0.01 |
| CCI (Commodity Channel Index, 20-period) | -69.12 |
RSI Plummets to 36.5 – Approaching Capitulation Territory
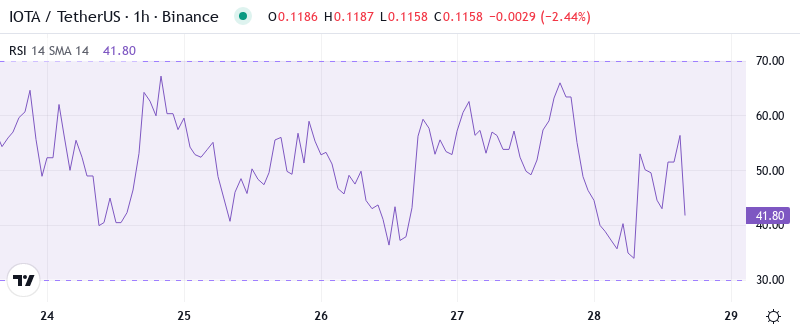
Reading the oscillator at 36.54 on the daily timeframe reveals momentum has shifted decisively bearish, though not yet at extreme oversold levels that typically mark bottoms. This rapid descent from neutral territory mirrors the velocity seen during IOTA’s August washout, when RSI briefly touched 30 before staging a relief bounce. Interestingly, the weekly RSI at 40.5 still holds above the critical 30 threshold, suggesting longer-term holders haven’t fully capitulated despite the harsh daily action. So for swing traders, this RSI configuration presents a classic dilemma – the daily oversold reading suggests a bounce could materialize soon, but the weekly structure warns that more downside remains possible. The Africa trade platform news, while fundamentally bullish, hasn’t yet translated into buying pressure strong enough to reverse these momentum indicators. Bulls need RSI to reclaim 40 on the daily to signal even a temporary bottom is forming.
ADX at 36.6 Confirms Sellers Control the Trend
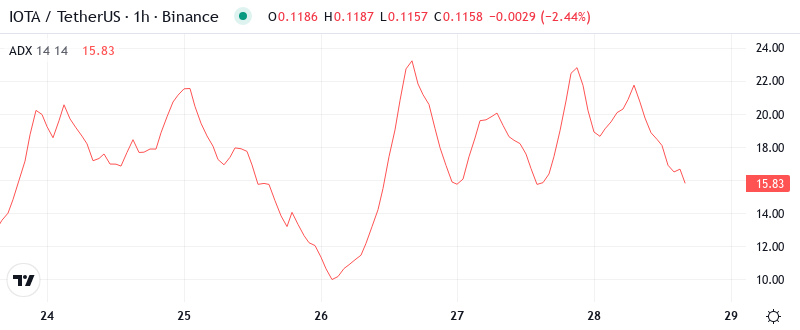
Trend strength readings paint a clear picture of directional conviction behind this move. At the level of 36.6, the ADX entry indicates sellers have firmly established control, with readings above 25 confirming we’ve shifted from December’s choppy consolidation into a genuine trending state. This marks the highest ADX print since the November breakdown, when similar readings preceded another 15% leg lower. Basically, day traders should align strategies with this confirmed downtrend rather than fighting it. The combination of ADX above 35 and price below all major EMAs creates a textbook trending environment where counter-trend trades carry elevated risk. It is worth mentioning that even the positive ADAPT initiative news couldn’t interrupt this technical cascade, emphasizing how trend momentum often trumps fundamentals in crypto markets during risk-off periods.
Moving Average Structure Collapses as 20-Day EMA Becomes Resistance at $0.124
Price action through the EMA ribbons tells a story of systematic support failure. IOTA now trades below the entire moving average stack – from the 10-day ($0.119) through the 200-day EMA at $0.171. Most critically, the 20-day EMA at $0.124 flipped from support to resistance after three failed recovery attempts this week, each rejection coinciding with news about the African stablecoin platform that should have sparked buying interest. Looking at the broader structure, the 50-day EMA at $0.138 looms as the next major resistance overhead, having rejected price action convincingly during last week’s relief attempt. This former support level now represents a 19% climb from current levels – a daunting task given the bearish momentum. The convergence of the 100-day ($0.154) and 200-day ($0.171) EMAs creates a formidable resistance cluster that would likely cap any sustained recovery attempts in the near term.
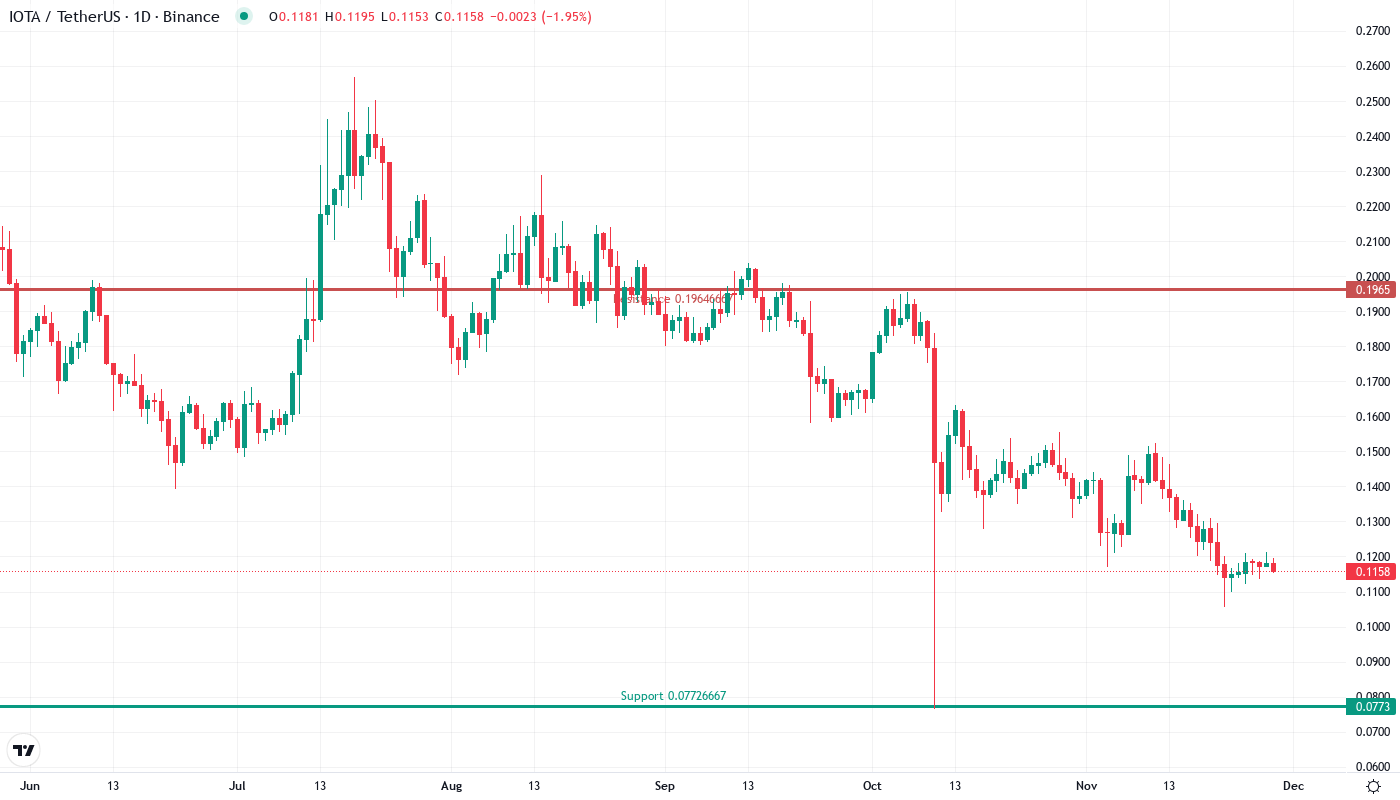
Support at $0.116 Faces Fourth Test as Resistance Stacks From $0.136 to $0.196
Above current price, sellers have fortified multiple resistance zones that would challenge any recovery attempt. The immediate barrier sits at December’s breakdown level of $0.136, which aligns with both the monthly pivot and the 50-day EMA. Beyond that, the psychological $0.15 level converges with the 100-day EMA, creating a confluence zone where profit-taking would likely emerge even if the Africa trade news generates fresh buying interest. Bulls defend the current $0.116 support with increasing desperation – this marks the fourth test since November, and each bounce has been weaker than the last. The June lows at $0.108 represent the next major support below, just 7% away, with the psychological $0.10 level lurking as the ultimate bear target. Volume patterns show accumulation attempts at current levels, possibly institutional players positioning for the ADAPT platform’s long-term potential.
The market structure reveals a clear bearish bias as long as price remains below $0.124. Each rally attempt gets sold into resistance zones, creating a pattern of lower highs that typically resolves with a final capitulation move. The disconnect between IOTA’s revolutionary role in digitizing African trade and its price action highlights how macro market forces can overwhelm even the most bullish fundamental developments in crypto.
Bears Target $0.10 While Bulls Need Decisive Close Above $0.124
Bulls require a decisive close above the 20-day EMA at $0.124 to signal even a temporary shift in momentum. Such a move would need to be accompanied by RSI reclaiming 40 and ideally some follow-through news about ADAPT platform adoption metrics. The measured move target from a successful reclaim would be $0.138, where the 50-day EMA waits to provide the next test.
The bearish scenario triggers if $0.116 support fails on volume, opening an air pocket down to $0.108 and potentially the psychological $0.10 level that would represent a 14% additional decline. This would trap recent buyers who entered on the Africa platform news, likely triggering stop-loss cascades that could briefly push RSI into extreme oversold territory below 25.
Given the confirmed downtrend and resistance stack overhead, the most probable near-term path is continued pressure on $0.116 support, followed by either a brief capitulation spike to $0.10 or a grinding consolidation between $0.108-$0.124. The Africa trade platform provides a fundamental floor that should eventually matter, but technical forces need to exhaust before that story can drive price action. Traders should respect the trend while monitoring for exhaustion signals.