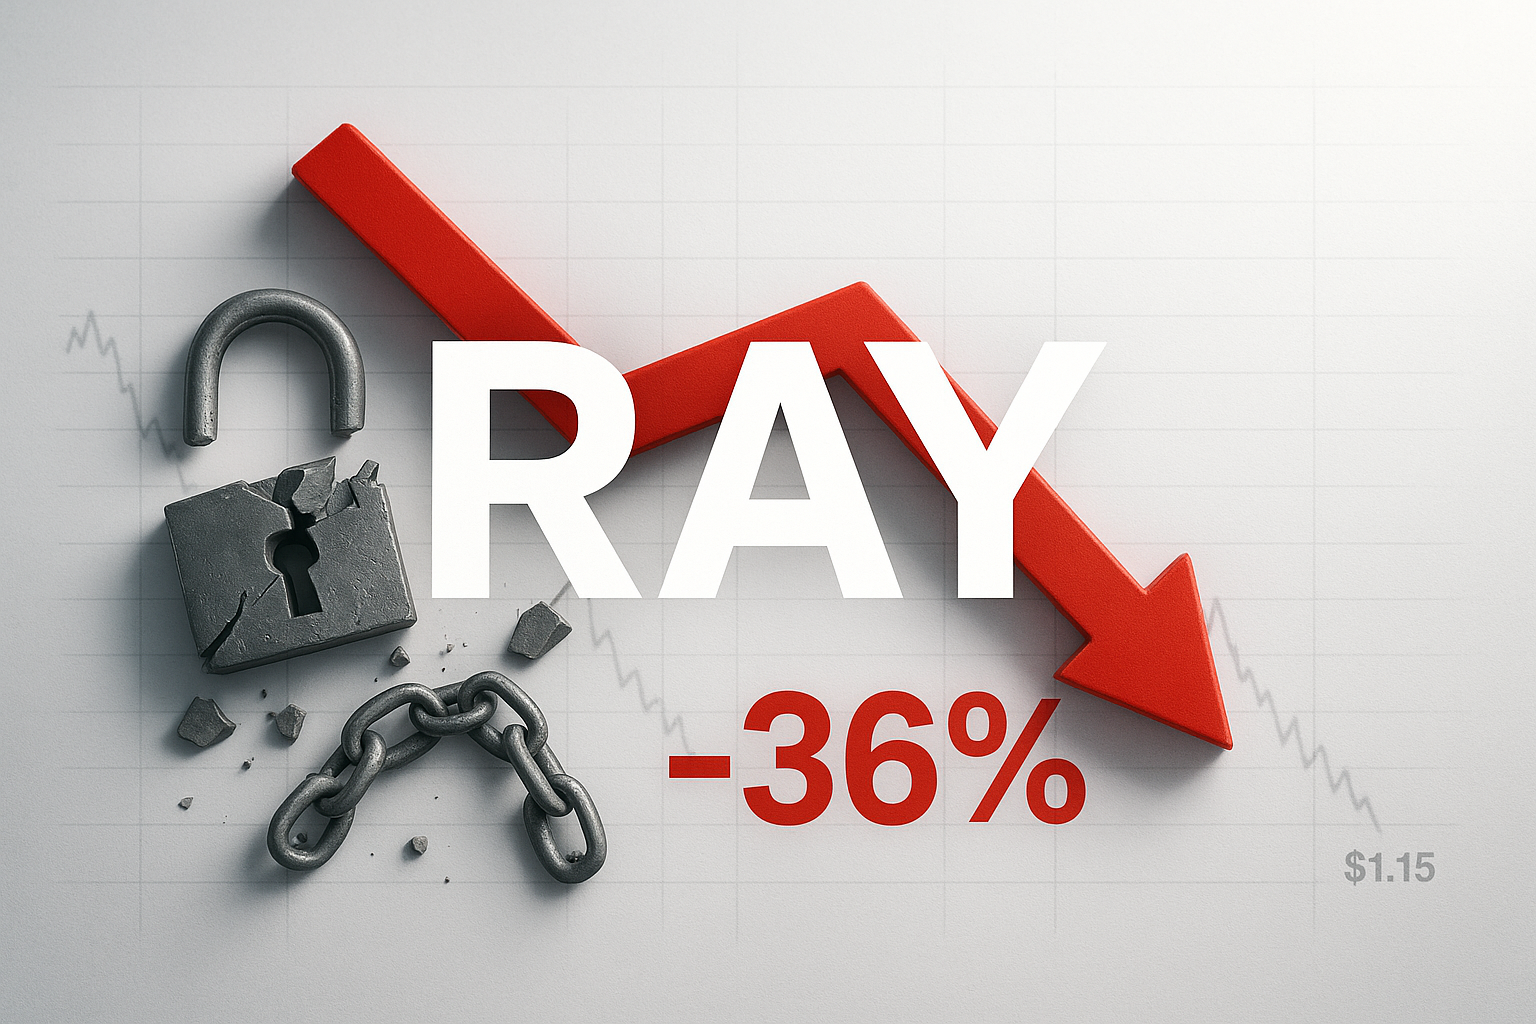
RAY Plummets 36% as Security Breach Shakes Trader Confidence Below $1.15
Market Structure Shifts Lower
- RAY tumbles 36.6% in seven days to $1.14 after Chrome extension scam surfaces
- Technical indicators flash oversold but momentum remains decisively bearish
- Support at $0.98 becomes critical as sellers control all major moving averages
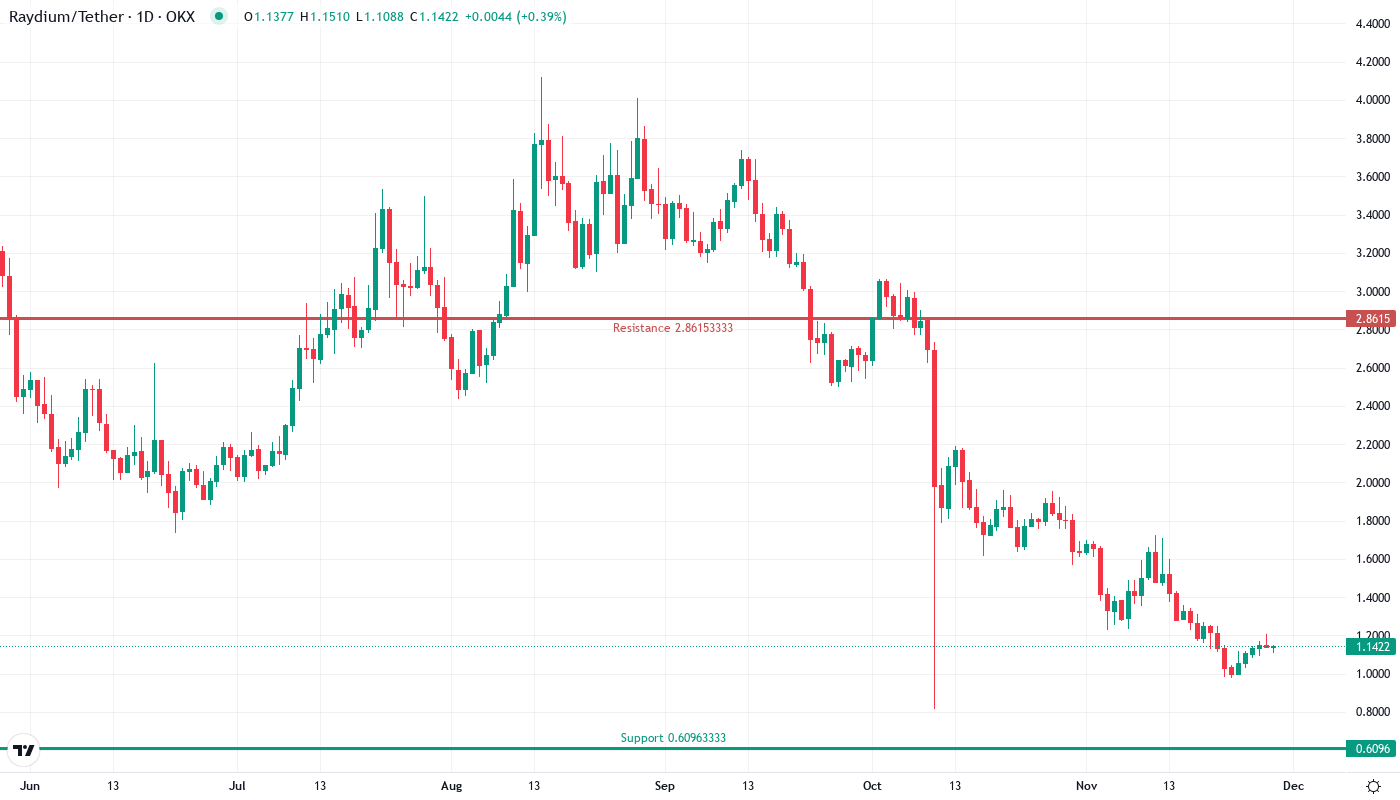
Raydium’s native token RAY has been hammered this week, shedding 36.6% to trade at $1.14 as revelations of a malicious Chrome extension exploiting the platform’s swap function sent traders rushing for the exits. The devastating drop erased roughly $0.65 per token in just seven days, with selling pressure intensifying after security researchers exposed how the “Crypto Copilot” plugin was secretly siphoning fees from unsuspecting Solana traders using Raydium. The main question for traders is: has RAY found a floor at current levels, or will the security breach fallout drive price toward the $0.98 monthly low?
| Metric | Value |
|---|---|
| Asset | RAYDIUM (RAY) |
| Current Price | $1.14 |
| Weekly Performance | 0.49% |
| Monthly Performance | -36.65% |
| RSI (Relative Strength Index) | 38.8 |
| ADX (Average Directional Index) | 39.8 |
| MACD (MACD Level) | -0.15 |
| CCI (Commodity Channel Index, 20-period) | -54.05 |
RSI Crashes to 38.76 – Deepest Oversold Territory Since Market Bottom
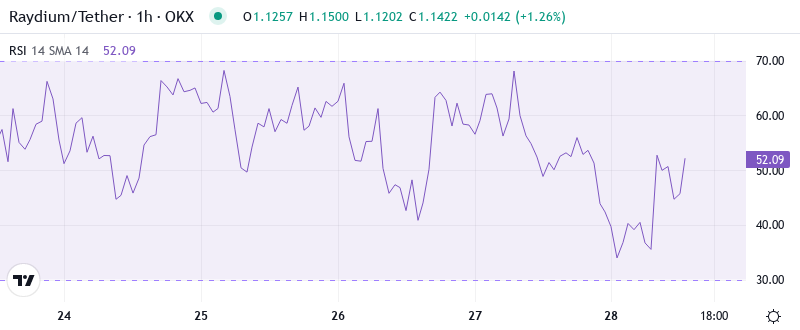
Reading the oscillator at 38.76, traders see momentum has swung violently bearish but approaches levels that historically marked significant bottoms. The RSI index dropped from neutral territory above 50 just last week into oversold conditions that match the severity of previous market washouts. Similar RSI configurations below 40 in past cycles often preceded sharp relief bounces, though the catalyst this time differs dramatically from typical market corrections.
So for swing traders, this oversold RSI creates a high-risk, high-reward setup where any positive news could spark a violent snapback rally. However, the security breach context means traditional oversold bounces might not materialize as quickly as technical traders expect – trust takes longer to rebuild than price. The weekly RSI at 34.15 confirms the bearish momentum extends beyond just daily timeframes, suggesting any bounce attempts will face significant overhead resistance.
ADX Spikes to 39.78 – Trend Strength Reaches Extreme Levels
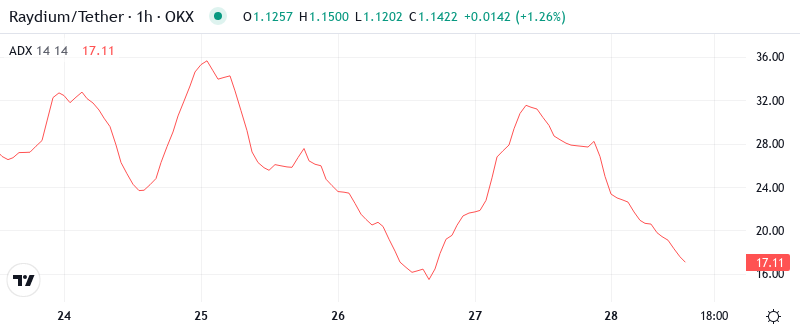
Trend strength exploded higher this week as ADX surged to 39.78, marking one of the strongest directional moves in RAY’s recent history. At this level, the ADX signals that sellers have taken complete control with conviction rarely seen outside major market events. The acceleration from the mid-20s to nearly 40 in just days shows how the security news transformed what might have been normal profit-taking into a full-scale exodus.
Therefore, day traders should adapt their strategies to this trending environment by following momentum rather than fighting it. Basically, when ADX reads this high, counter-trend trades become extremely dangerous as the trend has serious power behind it. The combination of extreme ADX readings with oversold momentum creates a powder keg scenario where the eventual reversal could be equally violent.
Price Trapped Below Entire EMA Ribbon Since Security News Broke
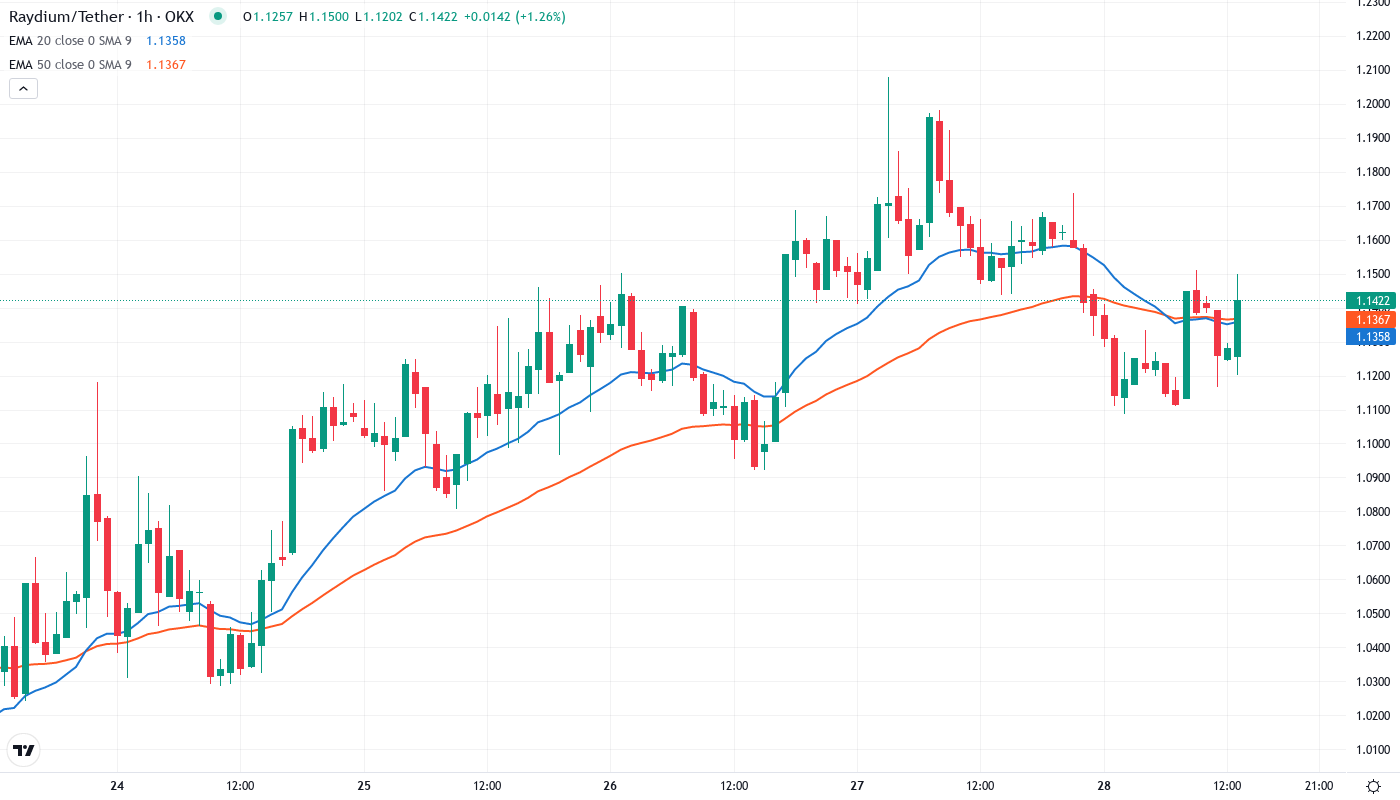
Looking at the moving average structure reveals complete technical breakdown, with RAY now trading below every major EMA from the 10-day ($1.36) down to the 50-day ($1.60). The 20-day EMA at $1.24 rejected yesterday’s relief attempt, confirming that what was support has flipped to resistance. Most telling is how quickly price collapsed through multiple support levels that held throughout previous corrections.
What’s significant is the compression between current price at $1.14 and the nearest EMA at $1.24 – roughly 9% overhead supply that bulls must absorb before even attempting to reclaim neutral territory. The 50-day EMA that provided reliable support during the November consolidation now sits 40% above current levels, illustrating the magnitude of technical damage inflicted by this security-driven selloff. Bulls need sustained volume and positive catalysts to repair this structure.
$0.98 Monthly Low Becomes Make-or-Break Support Level
Resistance clusters between $1.24 and $1.36 where the 20-day and 10-day EMAs converge with recent breakdown levels. Above that, sellers have stacked supply at $1.48 where trapped longs from last week will likely exit on any relief rally. The psychological $1.50 level adds another layer of resistance, creating multiple barriers bulls must overcome.
On the downside, the $0.98 monthly low emerges as absolutely critical support that bulls must defend to prevent a deeper cascade. This level has been tested multiple times throughout 2024 and represents the last line of defense before opening an air pocket down to $0.80. The lack of volume nodes between $0.98 and $0.80 means any breakdown could accelerate quickly.
This configuration resembles a bearish continuation pattern where the current pause around $1.14 represents mere consolidation before the next leg lower. The security breach fundamentally altered market structure from accumulation to distribution, visible in how former support zones instantly became resistance. Only a high-volume reclaim above $1.36 would signal the selling pressure has exhausted.
Bulls Need Immediate Reclaim Above $1.24 to Prevent Further Cascade
Bulls require a decisive close above the 20-day EMA at $1.24 within the next 48 hours to halt the bearish momentum. Should price reclaim this level with volume, targets would shift to $1.36 and eventually $1.48, though each resistance zone will likely see heavy selling from underwater positions. Any positive security updates or platform improvements could provide the necessary catalyst.
The bearish scenario triggers if RAY loses $0.98 support on a daily close – this would open floodgates toward $0.80 and potentially $0.65 in a capitulation event. Such a breakdown would trap recent bottom-fishers and likely cascade stop losses, especially given the fundamental uncertainty around platform security. Volume below $1.00 has been historically light, amplifying downside risk.
Given the technical damage and ongoing trust issues from the security breach, the most probable near-term path sees RAY consolidating between $0.98-$1.24 while the market digests the incident’s full impact. Traders should expect continued volatility with sharp moves in both directions, though the burden of proof remains on bulls to demonstrate that the platform’s reputation can recover alongside price.